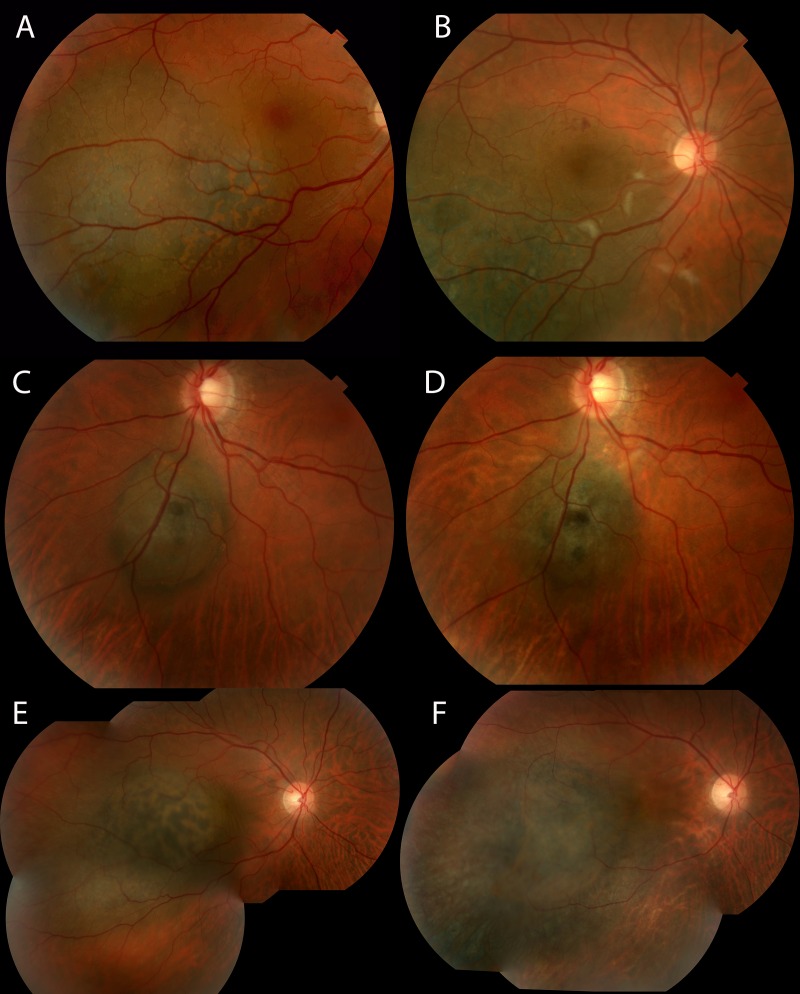
FIGURE 6.
Representative examples of patients from small/medium tumor group. A. Color fundus photograph of a patient at baseline with visual acuity 20/16. B. Same patient at month 24 with some clinical signs of radiation maculopathy. Visual acuity remains 20/16. C. Color fundus photograph of a patient at baseline with visual acuity 20/20. D. Same patient at month 24 with visual acuity 20/20. E. Color fundus photograph of patient at baseline with visual acuity 20/25. F. Same patient at month 24 with no signs of radiation maculopathy but decrease in visual acuity to 20/63.

