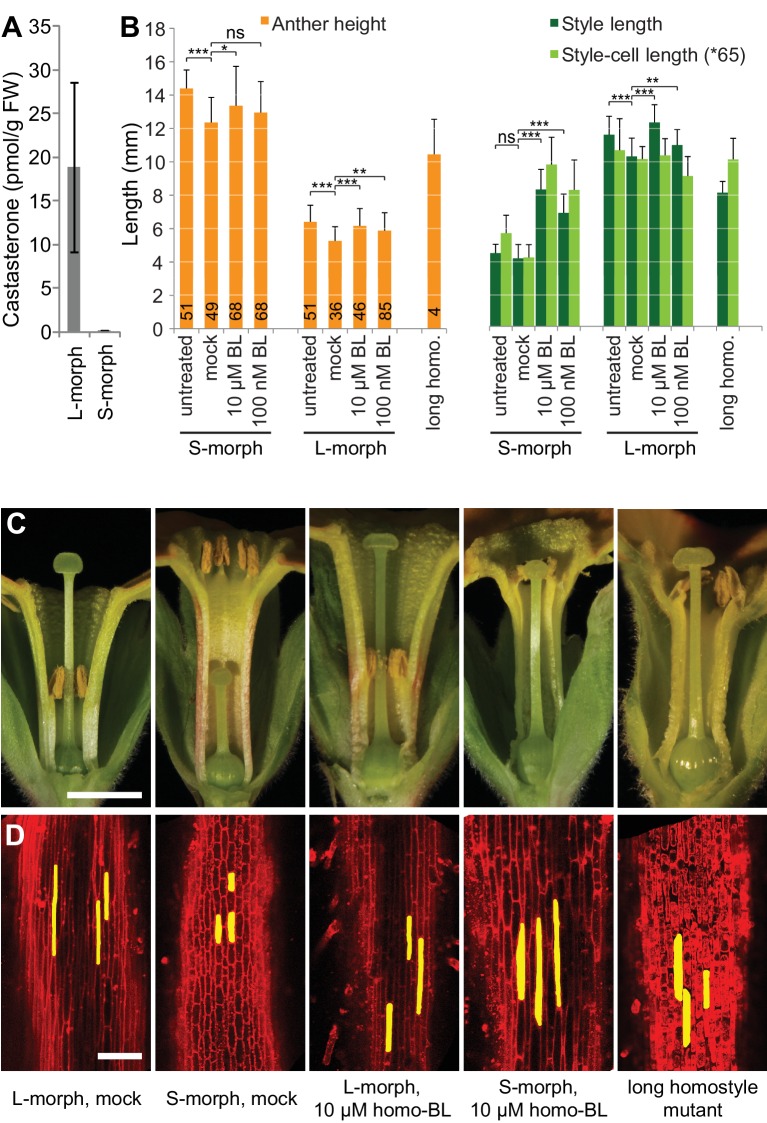
Figure 3. Endogenous brassinosteroid content in styles and response to exogenous brassinosteroid treatment in P. vulgaris.
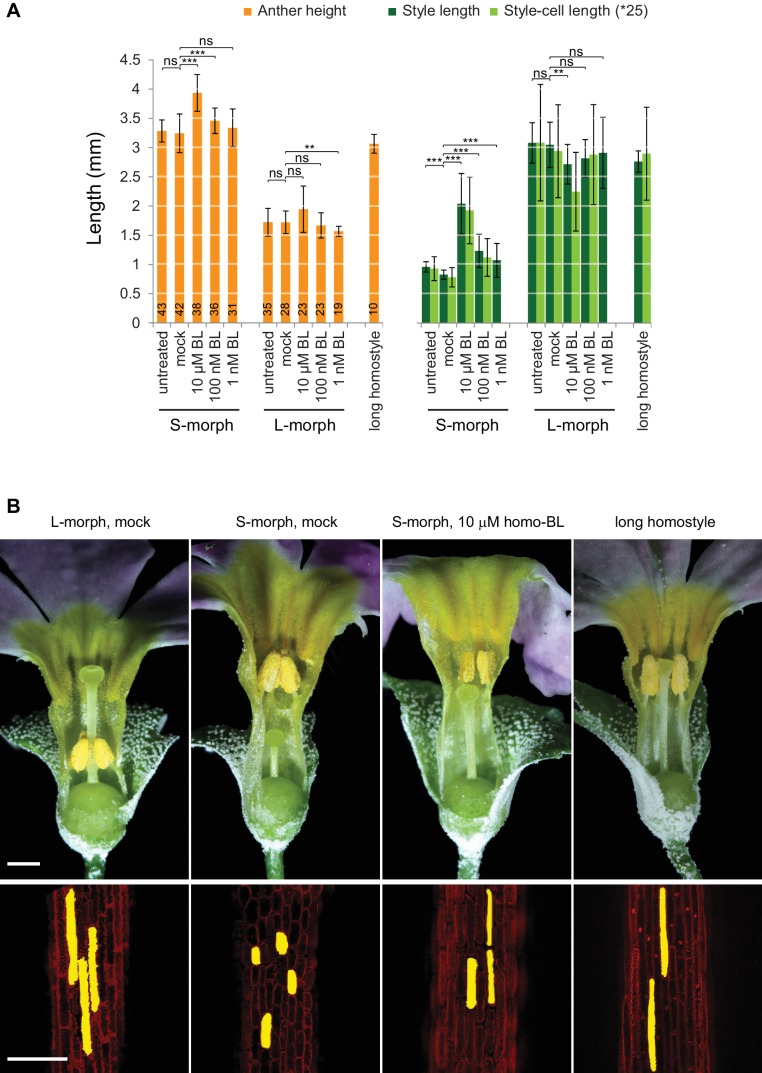
(A) Castasterone levels in styles of P. vulgaris. Values are mean ± SD from four biological replicates. (B) Anther height, style and style-cell lengths of plants with the indicated phenotypes after brassinolide (BL) treatment. Numbers of flowers used for stamen and style-length measurements are indicated in the bars. Six cells from 10 styles each were measured, except for long homostyle mutant (four styles). Values are mean ± SD. Samples were compared using a two-sided t-test assuming unequal variance, followed by Bonferroni correction. *p<0.05; **p<0.01; ***p<0.001. (C,D) Flower phenotypes (C) and style cells (D) from the indicated treatments. Representative cells are marked in yellow. Scale bars: 5 mm (C), 100 μm (D). A replicate experiment using P. forbesii is shown in Figure 3—figure supplement 1.


