. 2016 Sep 6;5:e17956. doi: 10.7554/eLife.17956

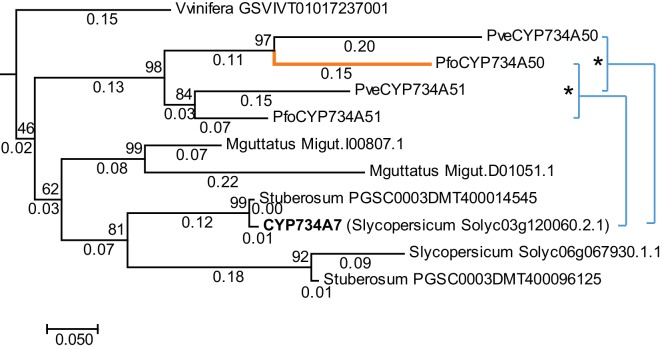
Figure 4. Phylogenetic analysis of CYP734A-like proteins.

Molecular phylogeny of CYP734A50-related proteins based on Neighbour Joining. The tree is drawn to scale, with branch lengths (below branches) measured as number of substitutions per site. Numbers next to nodes indicate percent support from bootstrap analysis (1000 replicates). Cyan brackets with asterisks show significant differences in evolutionary rates compared to CYP734A7 (bold) as outgroup as assessed by Tajima’s relative rate test (p<0.01). CYP734A7 causes BR-deficient phenotypes when overexpressed (Ohnishi et al., 2006). The orange branch shows evidence for relaxed constraint, but not for positive selection based on branch-site tests 1 and 2. The full tree is shown in Figure 4—figure supplement 1. Full results of branch-site tests 1 and 2 are shown in Figure 4—source data 2.

DOI: http://dx.doi.org/10.7554/eLife.17956.018

Figure 4—source data 1. Comparison of synonymous and non-synonymous substitution rates between CYP734A50 and CYP734A51 genes.
Results of Ka and Ks calculations for CYP734A50 and CYP734A51 genes using the Nei-Gojobori method with complete deletion of missing data. Ka and Ks rates were compared using Fisher’s exact test.
DOI: 10.7554/eLife.17956.019
Figure 4—source data 2. Full results of branch-site tests 1 and 2 for relaxed constraints or positive selection.
(A) Subtree as in Figure 4 with numbered branches for which branch-site tests were performed. The orange branch shows evidence of relaxed selection; the green branch shows evidence of positive selection. (B) Results of branch-site tests 1 and 2 for the indicated branches labelled in (A).
DOI: 10.7554/eLife.17956.020

Figure 4.

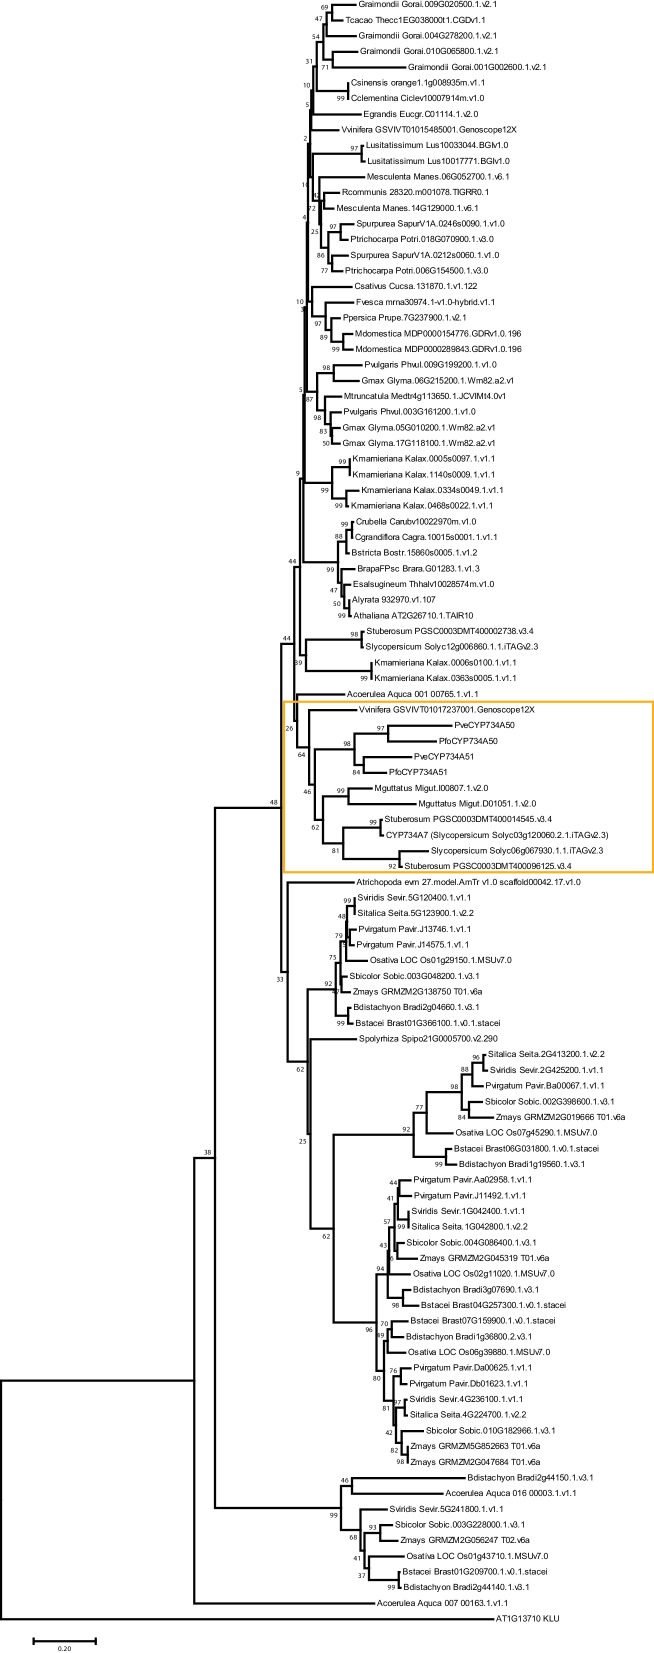
Figure 4—figure supplement 1. Phylogenetic analysis of CYP734A-like proteins.

Figure 4—figure supplement 1.

Molecular phylogeny of CYP734A50-related proteins based on Neighbour Joining. The tree is drawn to scale, with branch lengths proportional to number of substitutions per site. Numbers next to nodes indicate percent support from bootstrap analysis (1000 replicates). A. thaliana KLUH/CYP78A5 was used as outgroup. The subtree shown in Figure 4 is indicated by the orange box.

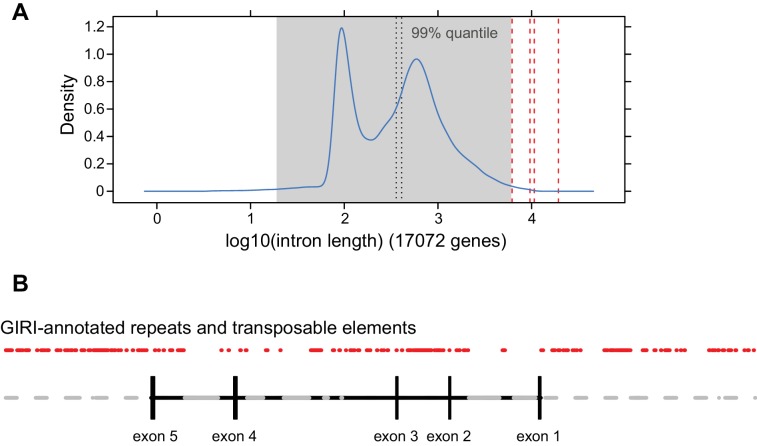
Figure 4—figure supplement 2. Analysis of CYP734A50 and CYP734A51 introns.

Figure 4—figure supplement 2.

(A) Density distribution of intron lengths in the P. veris genome. The four introns of the CYP734A50 locus are indicated by dashed red lines, as is the 99% quantile. CYP734A50 introns range from 6.2 to 19.3 kb, while the mean and median of P. veris intron sizes are 668 and 410 bp, respectively. This difference is significant at p<10–4 based on Wilcoxon rank sum test. (B) Annotation of transposable elements and repeats in CYP734A50 introns from P. veris according to GIRI. Grey areas in introns indicate stretches of unresolved sequences.