
Figure 12. Relative ferroxidase activity of EncFtnsH mutants.
EncFtnsH, and the mutant forms E32A, E62A and H65A, each at 20 µM, were mixed with 100 µM acidic Fe(NH4)2(SO4)2. Ferroxidase activity of the mutant forms is determined by measuring the absorbance at 315 nm for 1800 s at 25 °C as an indication of Fe3+ formation. The relative ferroxidase activity of mutants is plotted as a proportion of the activity of the wild-type protein using the endpoint measurement of A315. Three technical repeats were performed and the plotted error bars represent the calculated standard deviations. The FOC mutants showed reduced ferroxidase activity to varied extents, among which E62A significantly abrogated the ferroxidase activity.
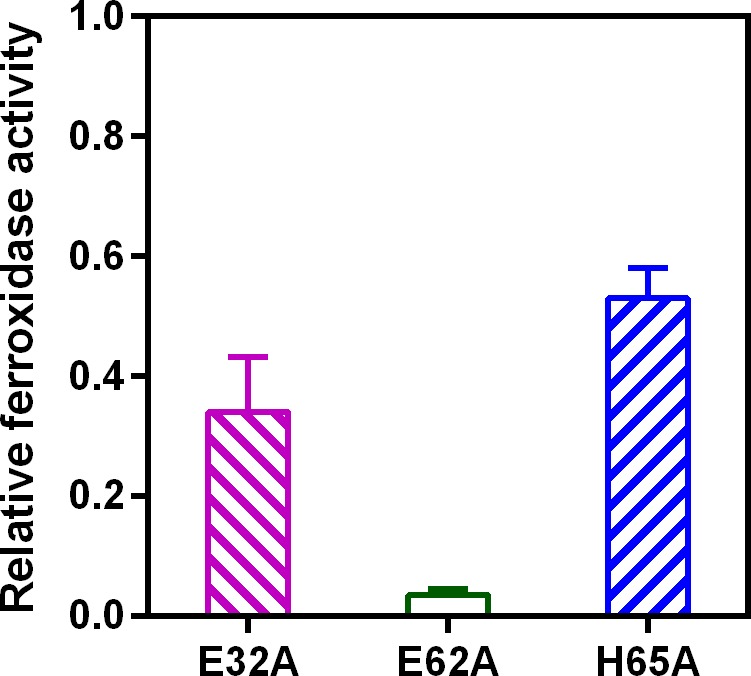
Figure 12—figure supplement 1. Progress curves recording ferroxidase activity of EncFtnsH mutants. 20 µM wild-type EncFtnsH, E32A, E62A and H65A mutants were mixed with 20 µM or 100 µM acidic Fe(NH4)2(SO4)2, respectively.

Absorbance at 315 nm was recorded for 1800 s at 25°C as an indication of Fe3+ formation. Protein free samples (dashed and dotted lines) were measured for Fe2+ background oxidation as controls. Assays were performed with three technical repeats. Error bars were showed in shadows behind each curves.