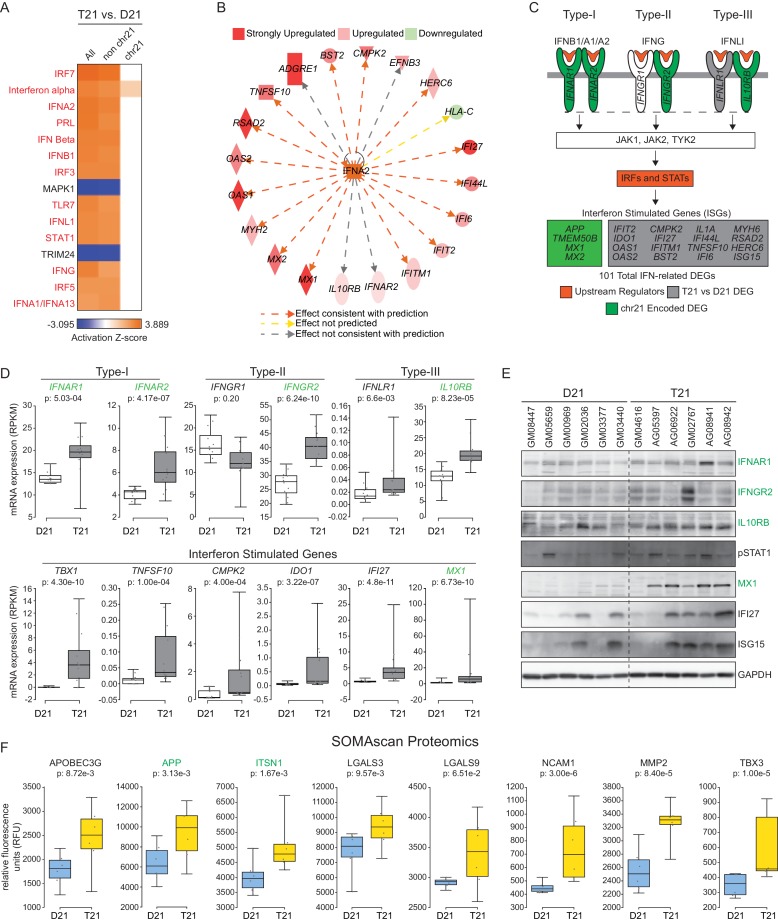
Figure 2. The interferon (IFN) transcriptional response is activated in trisomy 21 (T21) fibroblasts.
(A) Upstream regulator analysis of the T21-associated gene expression signature using Ingenuity Pathway Analysis (IPA) predicts numerous IFN-related factors as activated in T21 cells. (B) Representative results of the upstream regulator analysis for the Type I IFN ligand IFNA2. (C) Graphical summary of the observed deregulation of the IFN pathway in T21 fibroblasts, showing the six IFN receptor subunits, four of which are encoded on chr21 and significantly upregulated in T21 fibroblasts; the predicted upstream regulators (orange), including the Type I, II, and III IFN ligands, as well as the IFN-activated transcription factors (IRFs and STATs); and select examples of Interferon Stimulated Genes (ISGs) upregulated in T21 fibroblasts, either encoded on chr21 (green) or elsewhere in the genome (gray). (D) Box and whisker plots showing RNA expression for the six IFN receptor subunits and select ISGs. chr21-encoded genes are highlighted in green. mRNA expression values are displayed in reads per kilobase per million (RPKM). Benjamini-Hochberg adjusted p-values were calculated using DESeq2. (E) Western blot analysis confirming upregulation of IFN receptors, STAT1 phosphorylation, and ISGs, in T21 fibroblasts. (F) Box and whisker plots showing protein expression of select IFN-related genes as measured by SOMAscan assay. chr21-encoded genes are highlighted in green. Protein expression values are displayed in relative fluorescence units (RFU). Adjusted p-values were calculated using the Empirical Bayes method in QPROT.


