. 2016 Jul 29;5:e16220. doi: 10.7554/eLife.16220

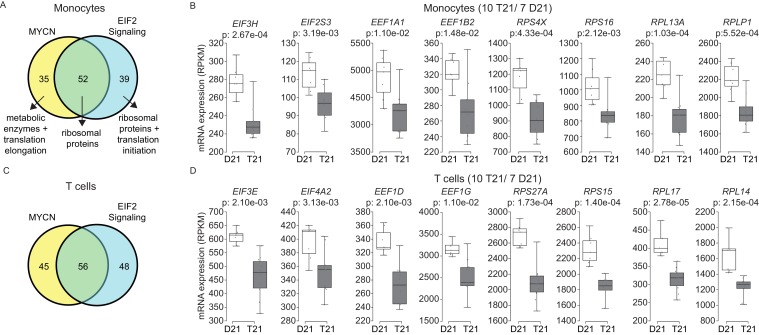
Figure 7. Trisomy 21 globally downregulates the translation machinery in monocytes and T cells.

(A) Venn diagram demonstrating the overlap in DEGs comprising the MYCN upstream regulator and EIF2 signaling pathway gene signatures identified by IPA in monocytes. Prominent components of each group are indicated with arrows. See also Figure 7—figure supplement 2. (B) Box and whisker plots of RNA expression for representative translation-related genes from monocytes. mRNA expression values are displayed in reads per kilobase per million (RPKM). Benjamini-Hochberg adjusted p-values were calculated using DESeq2. (C) Venn diagram demonstrating the overlap in DEGs as in (A) for T cells. (D) Box and whisker plots of RNA expression as in (C) for T cells.

DOI: http://dx.doi.org/10.7554/eLife.16220.020

Figure 7.

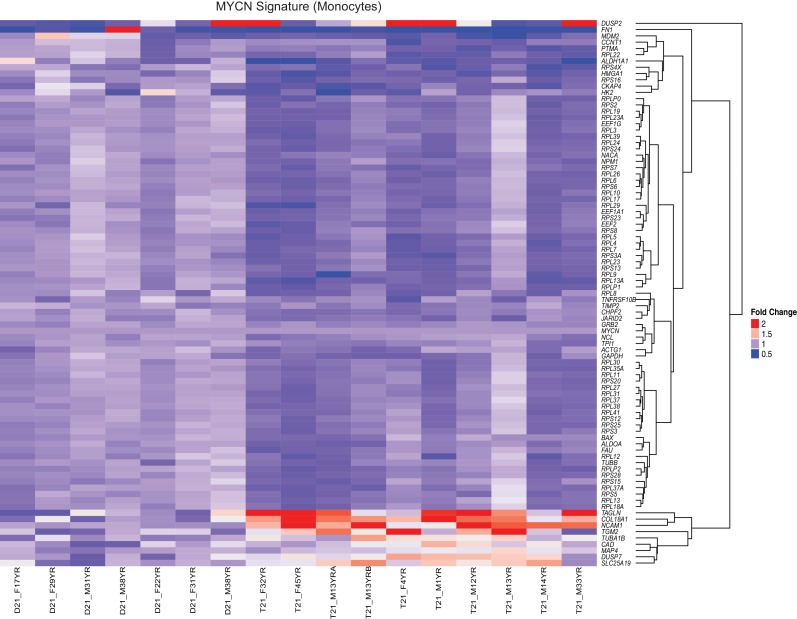
Figure 7—figure supplement 1. The MYCN transcriptional program is downregulated by T21.

Figure 7—figure supplement 1.

A heatmap demonstrates downregulation of numerous components of the translational machinery associated with MYCN-driven transcription in monocytes from individuals with T21. The data presented are the fold change of the RPKM of each sample relative to the mean RPKM of all D21 individuals.
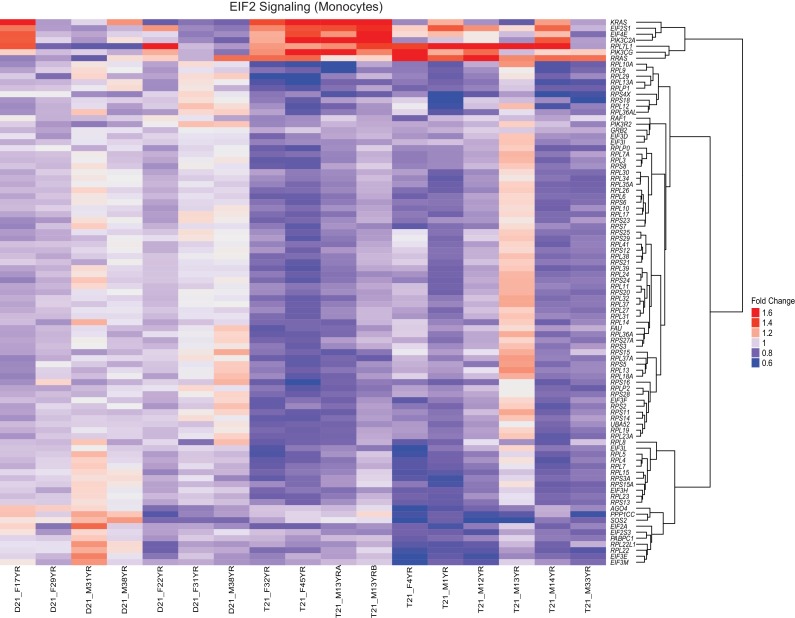
Figure 7—figure supplement 2. The EIF2 Signaling pathway is downregulated by T21.

Figure 7—figure supplement 2.

A heatmap demonstrates downregulation of numerous components of the translation machinery associated with EIF2 Signaling in monocytes from individuals with T21. The data presented are the fold change of the RPKM of each sample relative to the mean RPKM of all D21 individuals.