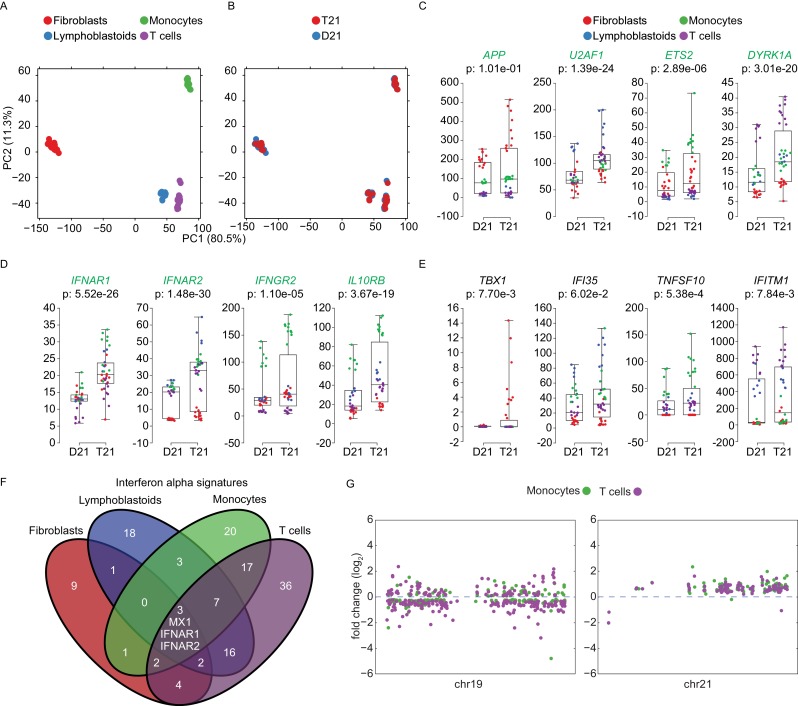
Figure 8. Trisomy 21 activates the IFN gene expression program in a cell type-specific manner.
(A) Principal component analysis (PCA) of all RNA-seq samples from this study colored by cell type. (B) PCA analysis as in (A) colored by chr21 copy number. (C) Box and whisker plots of RNA expression for representative chr21-encoded genes from all samples. mRNA expression values are displayed in reads per kilobase per million (RPKM). Benjamini-Hochberg adjusted p-values were calculated using DESeq2 by comparing all T21 samples to all D21 samples. Individual data points are colored by cell type. (D,E) Box and whisker plots as in (C) for chr21-encoded IFN receptors and representative ISGs. (F) Venn diagram showing the cell type-specificity of the Interferon alpha gene expression programs identified by IPA for each cell type. (G) Manhattan plots for chromosomes 19 and 21 comparing the DEGs from monocytes and T cells derived from the same individuals.

