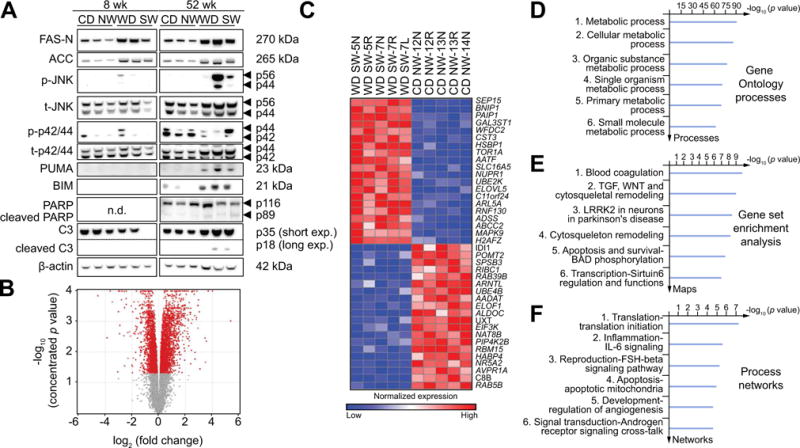
Fig. 4. Activation of signaling pathways relevant to human NASH in the liver of DIAMOND mice.

(A) Whole cell lysates were prepared from liver tissue from B6/129 mice fed a chow diet (CD NW) or high fructose/glucose, high fat Western Diet (WD SW) for 8 or 52 weeks. Immunoblot analysis were performed for FAS-N, acetyl-CoA carboxylase (ACC), phosphorylated and total JNK (p-JNK and t-JNK), phosphorylated and total p42/p44 (p-p42/p44 and t-p42/p44), PUMA, BIM, PARP displaying cleaved PARP product p89 and caspase-3 (C3) displaying cleaved caspase-3 product p18. The cleaved form of C3 was only visualized after long exposure times. β-actin was used as a control for protein loading. Bands were cut and combined from the same radiograph. (B–F) Transcriptome analysis was performed on liver tissues from CD NW or WD SW mice after 8 weeks of diet (n = 5 per group). The data are presented as: (B) volcano plot; (C) Heat map demonstrating deregulated genes. Red and blue colors indicate high and low gene expression, respectively; (D) Gene ontology (GO) processes; (E) Gene set Enrichment Analysis (GSEA); and (F) Process Networks analysis. The top rank ordered processes, maps and networks are based on statistical significance.
