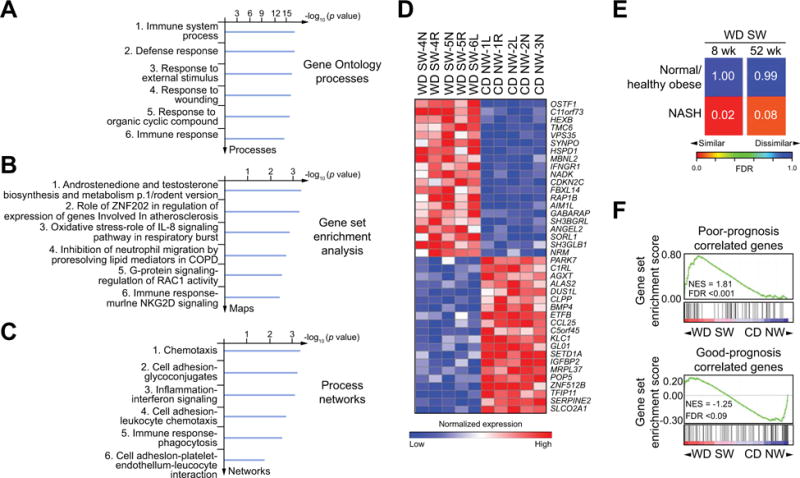
Fig. 5. Hepatic gene expression dataset in DIAMOND mice at 52 weeks concords with a human liver cirrhosis and NASH-associated gene signature.

Transcriptome analysis was performed on liver tissues from B6/129 mice fed a chow diet (CD NW) or a high fructose/glucose, high fat Western diet (WD SW) mice for 52 weeks (A–F) and 8 weeks (E) (n = 5 per group). (A) Gene ontology (GO) processes; (B) Gene set Enrichment Analysis (GSEA); (C) Process Networks analysis. The top rank ordered processes, maps and networks are based on statistical significance; (D) Heat map demonstrating deregulated genes. Red and blue colors indicate high and low gene expression, respectively. (E) Similarity between global liver transcriptome of mice fed a WD SW for 8 or 52 weeks and global liver transcriptome in liver biopsy tissues from 18 human NASH patients and 41 normal/healthy obese individuals using subclass mapping algorithm (see Supplementary materials and methods). Numbers on heat map indicate FDR values for the transcriptome similarity. (F) Concordance by GSEA between a 186-gene signature prognostic (73 poor prognosis-correlated and 113 good prognosis-correlated genes) in human liver cirrhosis and HCC from mixed etiologies and the pattern of gene expression in DIAMOND mice at 52 weeks NES, normalized enrichment score; FDR, false discovery rate.
