
Fig. 6. Tumors gene signature in DIAMOND mice at 52 weeks.
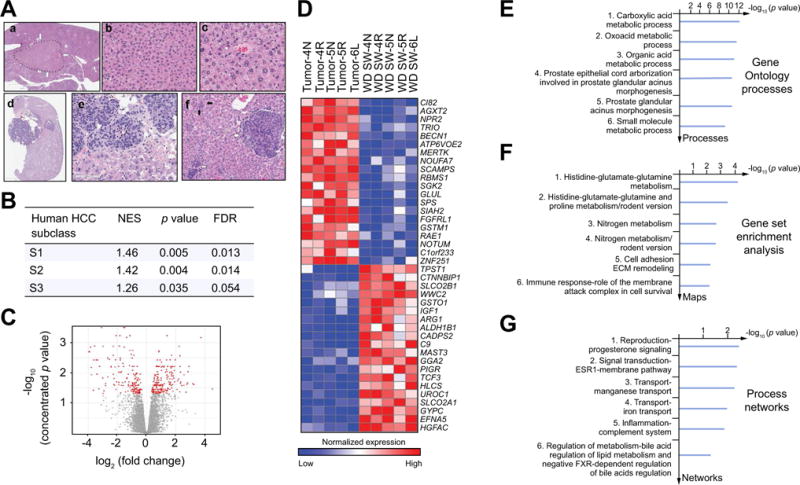
(A) Microscopic views of adenomas (a, b, c) and hepatocarcinomas (HCC) tumors (d, e, f) from B6/129 mice fed a high fructose/glucose, high fat Western diet (WD SW) for 52 weeks. (a) adenoma, (hematoxylin-eosin (H&E), original magnification, ×2.5); (b) cords of hepatocytes with mild atypia and trabecular organization (H&E, original magnification, ×20); (c) unpaired artery between hepatocytes with mild anisocaryosis (H&E, original magnification, ×40); (d) a basophilic well-demarcated tumor with a satellite nodule and with steatosis in the background liver (H&E, original magnification, ×2); (e) interface between malignant tumor (top half) and non-tumoral liver. The lobules of tumoral cells show marked anisocaryosis, eosinophilic cytoplasm, irregular basophilic nuclei and loss of sinusoidal architecture (H&E, original magnification, ×40); (f) satellite nodules made of clusters of tumoral cells (white arrow) and dysplastic foci with multinucleated irregular hepatocytes (black arrow) (H&E, original magnification, ×20). (B) Concordance by gene set enrichment analysis (GSEA) between the gene signatures of human HCC subclasses S1, S2, and S3 and WD SW-induced HCCs in mice at 52 weeks. NES, normalized enrichment score; FDR, false discovery rate. (C–G) Transcriptome analysis was performed on liver adjacent to tumors (WD SW) or tumor tissue (HCC) from WD SW mice at 52 weeks (n = 5). (C) volcano plot; (D) Heat map demonstrating deregulated genes. Red and blue colors indicate high and low gene expression, respectively; (E) Gene ontology (GO) processes; (F) Gene set Enrichment Analysis (GSEA); and (G) Process Networks analysis. The top rank ordered processes, maps and networks are based on statistical significance.