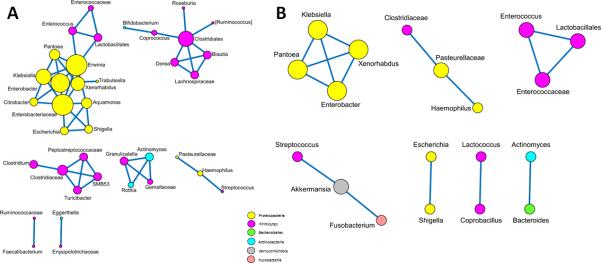
Figure 4.
Spearman correlation demonstrating taxon-taxon relative abundance including links with absolute value of correlation > 0.5 and False Discovery Rate-corrected p-value < 0.05. Network analyses displayed with Cytoscape using an edge-weighted spring embedded layout in responders (A) and non-responders (B). Positive correlations are shown as blue links between nodes and only significant correlations are depicted. The size of the node was based on the number of correlations associated with the corresponding taxon. The color of the node is based on the phylum level: Actinobacteria (blue), Bacteroidetes (green), Firmicutes (purple), Proteobacteria (yellow), Fusobacteria (pink) and Verrucomicrobia (grey). There is a three-fold decrease in the number of taxon correlations in the non-responders and most of the decreased nodes were Firmicutes and Actinobacteria.

