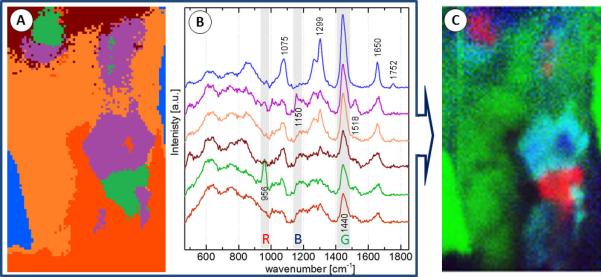
Figure 2.

Raman processing summary: The k-means result from the region of interest with k=6 (A) and corresponding mean cluster spectra (B). Several bands of interest were selected (see text) and their integrated band intensities are displayed in RGB false color image to the left (C).
