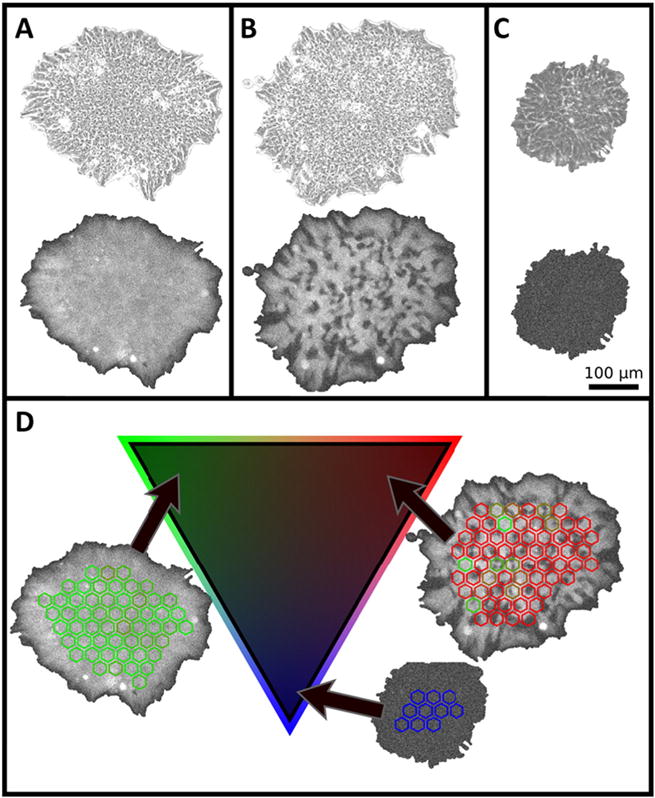
Fig. 3.

Quantifying apparent heterogeneity in Oct4 expression. (A–C) Representative colonies from preparation 3 showing phase contrast (top images) and fluorescence images of (A) a colony that is apparently homogeneous in Oct4 expression, (B) a colony that is heterogeneous in Oct4 expression, and (C) a colony that is not expressing Oct4. (D) Quantitation of heterogeneity was performed by texture analysis of 900 μm2 hexagons within colonies as depicted in the representative colony images; using a simplex algorithm, each colony in the preparation is assigned to a position on the triangle (2-simplex) according to its heterogeneity score: representative colonies that are either homogeneously bright (green), heterogeneous in GFP expression (red) or expressing little to no GFP (blue) are shown with their respective locations on the triangle.
