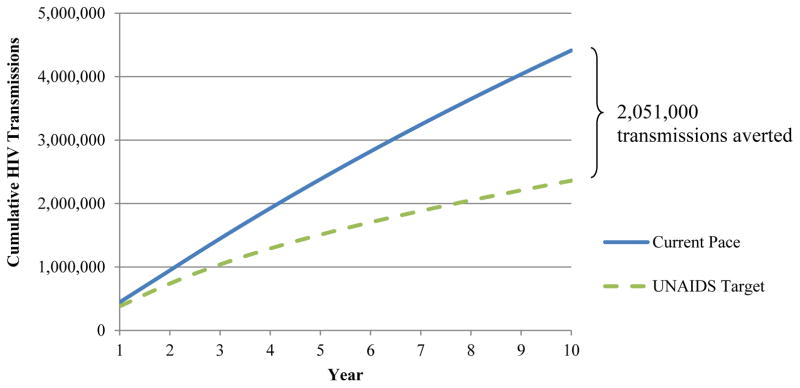
Appendix Figure 1. Cumulative HIV transmissions.
The cumulative number of HIV transmissions (vertical axis) over the 10-year modeled horizon (horizontal axis). Results for the Current Pace strategy are shown by the blue solid curve and for the UNAIDS Target strategy are shown by the green dashed curve. By the end of 2025, the UNAIDS Target strategy results in 2.051 million fewer transmission events.

