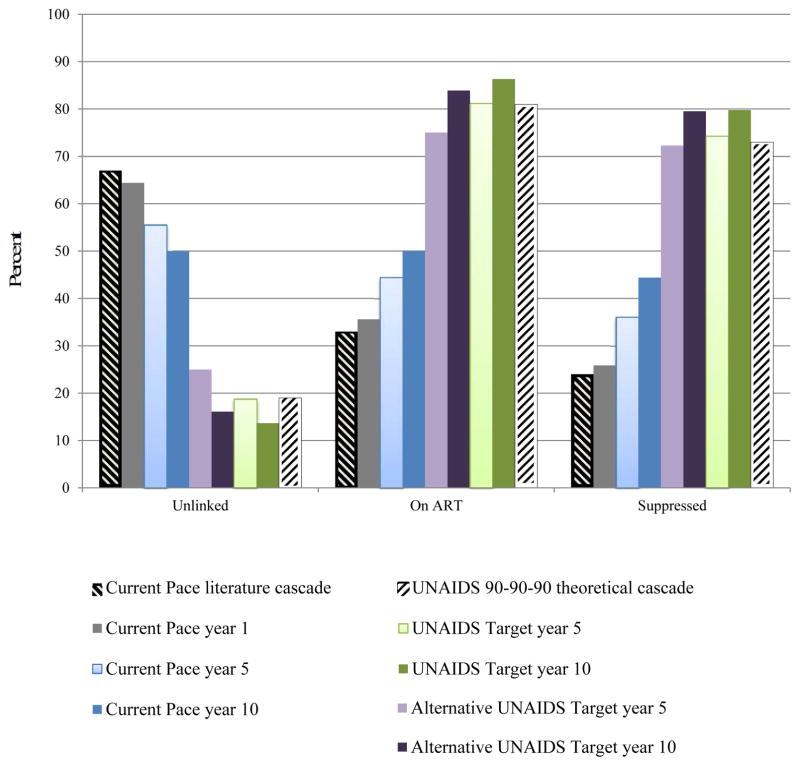
Appendix Figure 2. HIV treatment cascade by cascade strategy; sensitivity analysis of an alternative way of reaching virologic suppression goals for the UNAIDS Target strategy.
This demonstrates results of the HIV treatment cascade over time, examining the proportion of patients alive (vertical axis) who are unlinked, on ART, or virologically suppressed (horizontal axis). Current Pace strategy: The hatched black bar on the left demonstrates literature-based data to inform the current South Africa cascade of care. The grey bar represents model-based results after 1 year of the current cascade and demonstrates a near match to the black bar, except for some anticipated modest improvement over time, with slight decreases among those unlinked with concomitant increases in those suppressed. Bars in blue provide current cascade results over 5-year (light blue) and 10-year (dark blue) and further demonstrate modest improvements in the cascade. At 10 years, the current cascade shows 44% of those alive are virologically suppressed. UNAIDS Target strategy and Alternative UNAIDS Target strategy. This figure utilizes alternative input parameters (lower testing and linkage rates and higher rates of virologic suppression), compared to the UNAIDS Target strategy base case to achieve viral suppression goals in the Alternative UNAIDS Target strategy, without 81% of persons on ART. The hatched white bar on the far right demonstrates the aspirational 90-90-90 cascade with 73% virologically suppressed. Model output demonstrates 90-90-90 basecase results that might be achieved in 5 and 10 years (in light and dark green) and cascade states at 5 and 10 years in the Alternative UNAIDS Target strategy (light and dark purple). While the UNAIDS Target strategy and the Alternative UNAIDS Target strategy have similar viral suppression rates (~73%), they differ in the proportion of persons on ART (81% in the UNAIDS Target strategy and 75% in the Alternative UNAIDS Target strategy). The denominators (number alive) in these three strategies over time differ as a result of differences in the number of transmissions and deaths.

