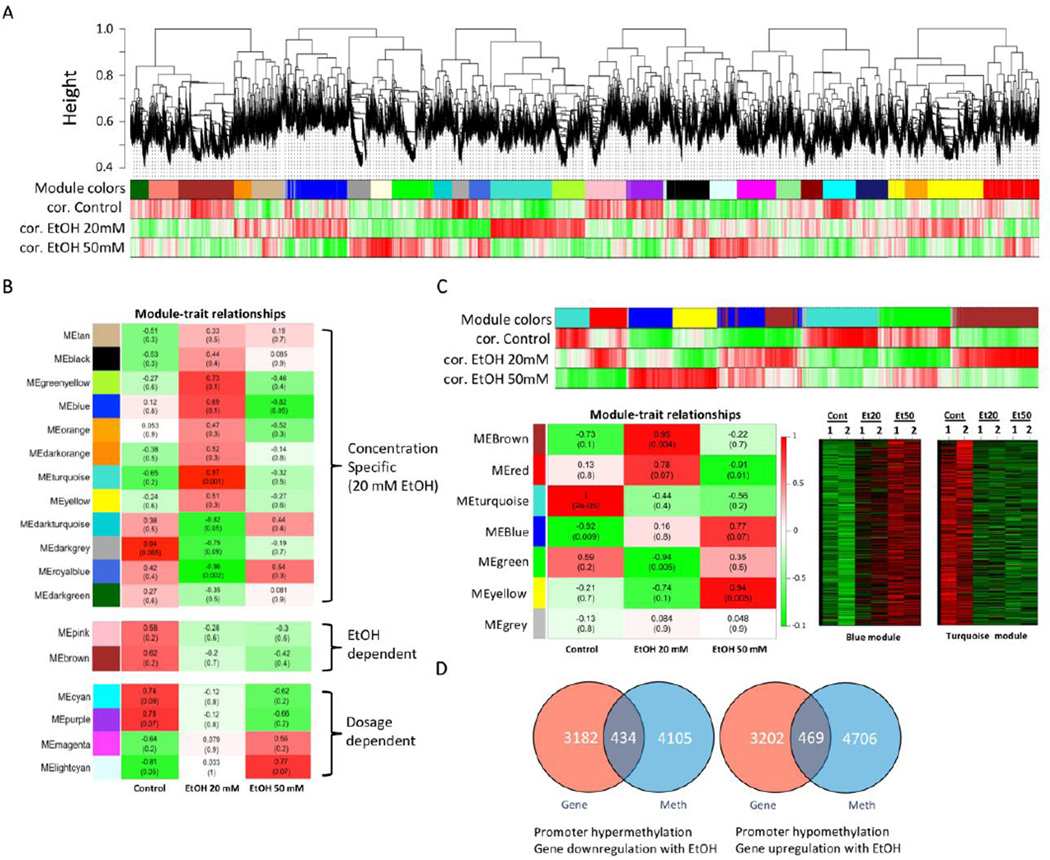
Figure 1. Transcriptome analysis by gene expression microarray.
A. Weighted Gene Co-Expression Network Analysis (WGCNA) was performed to identify transcriptomic changes in DPSCs induced by EtOH. Expression microarray data was processed by WGCNA and modules of genes that are correlated together were identified. Modules are clusters of highly interconnected genes. In an unsigned co-expression network, modules correspond to clusters of genes with high absolute correlations. In a signed network, modules correspond to positively correlated genes. A group of genes (module) correlated to Control (cor. Control without EtOH treatment), EtOH 20 mM (cor. EtOH 20 mM) or EtOH 50 mM (cor. EtOH 50 mM) was depicted by different colors (module colors). B. Intramolecular connectivity measures how connected, or co-expresses, a given gene is with respect to the genes of a particular module. The intramolecular connectivity is interpreted as a measure of module membership. Module-trait relationship map of all modules identified from analysis demonstrating specific EtOH concentration-dependent, EtOH treatment-dependent, or EtOH dosage-dependent gene association modules. C. WGCNA analysis on DNA methylomic changes to identify modules associated with EtOH treatment and epigenetically regulated by EtOH-induced DNA methylation in DPSCs. Most significant modules were selected from the module-trait detection and corresponding heat-maps (blue and turquois modules) are shown. D. Venn diagram analysis of transcriptome vs. DNA methylation to display the number of epigenetically regulated genes. Dosage-dependent hypermethylation and correlated decrease in gene expression due to EtOH. Dosage-dependent hypomethylation and correlated increase in gene expression due to EtOH.

