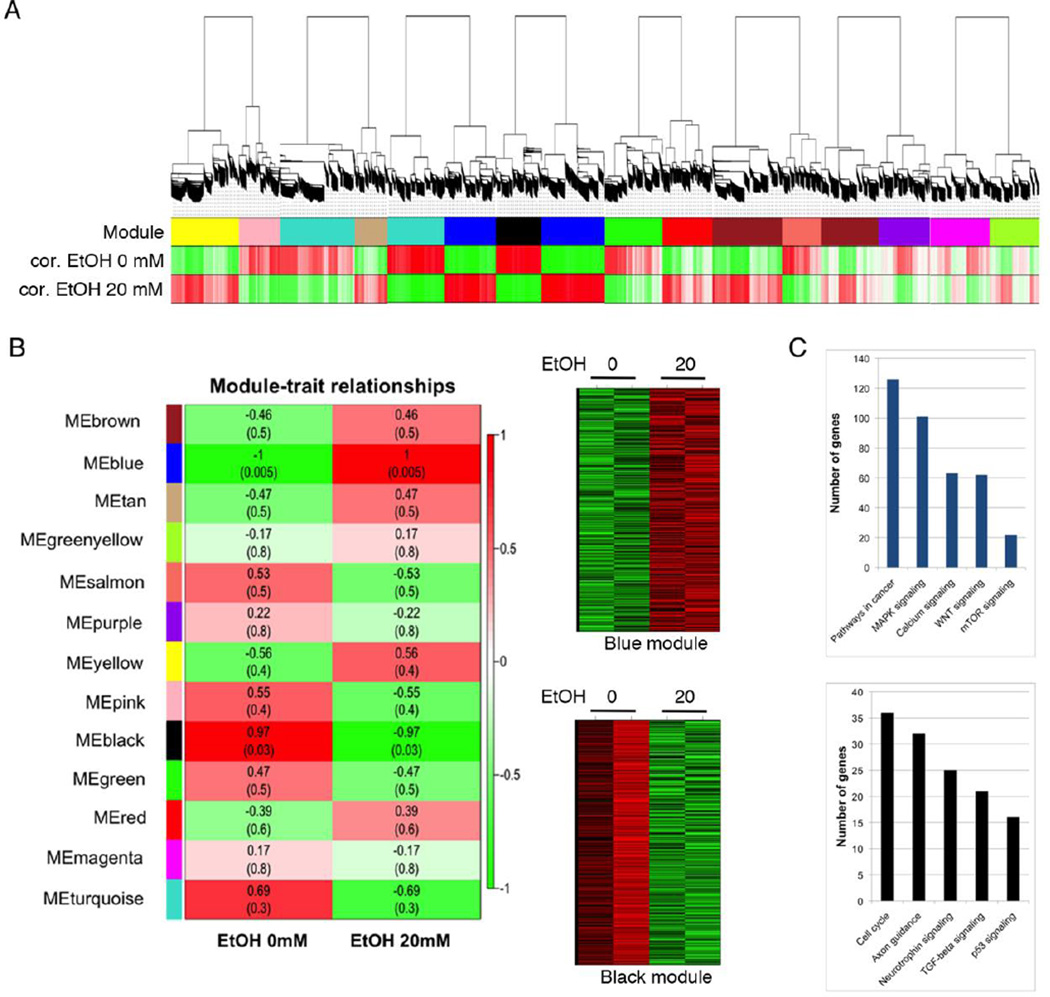
Figure 2. WGCNA on DPSCs treated with 20 mM EtOH.
A. WGCNA for transcriptomic changes induced by 20 mM EtOH treatment that is comparable to a 0.08% blood alcohol concentration (BAC) of the DUI level, leads to EtOH-induced gene expression changes in DPSCs. B. Module-trait relationship map and heatmap analysis of the black and blue modules, or gene expression profiles, where red indicates up-regulation and green indicates down-regulation. C. The Database for Annotation, Visualization and Integrated Discovery (DAVID) gene functional analysis on the blue and the black module.

