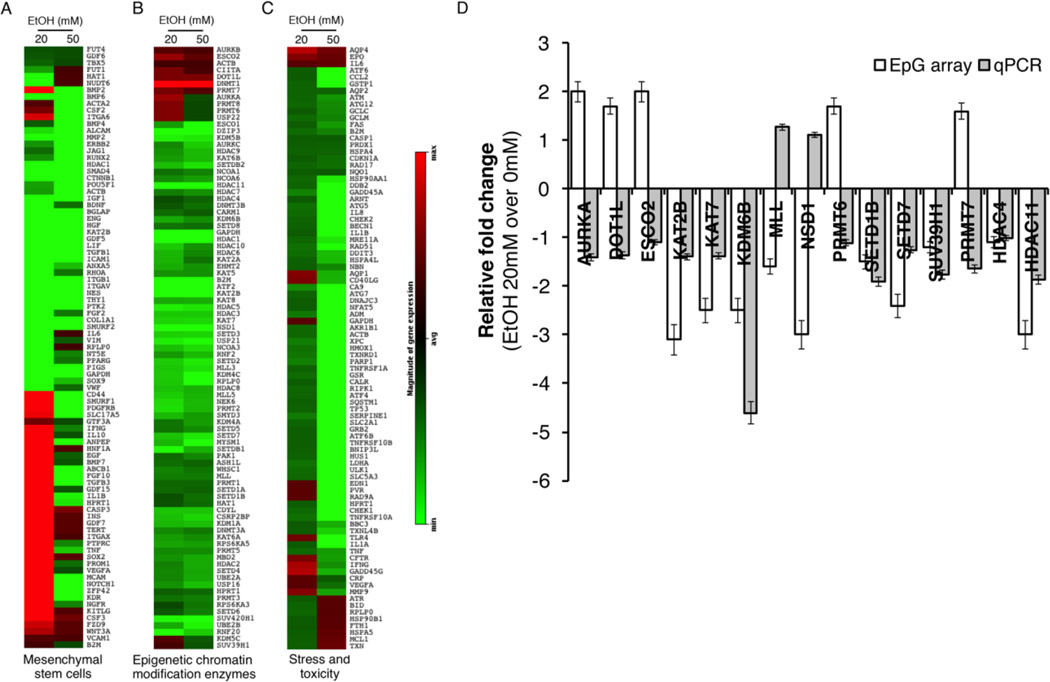
Figure 3. Pathway focused RT-PCR array analysis for genes affected in DPSCs by EtOH treatment.
For acute exposure DPSCs were treated for 24hrs with 20 or 50mM EtOH. For chronic exposure cells were treated every other day for 10 days with 20 or 50mM EtOH. Total RNA was prepared and subjected to RT-PCR array analysis. A. Fibroblastic marker array, B. Epigenetic chromatin modification enzymes array. C. Stress and toxicity pathway finder array. Data was analyzed and fold changes against no treatment are presented. D. Quantitative RT-PCR analysis was done to validate the result from Epigenetic modifier RT array. Error bar shows the standard error margin (SEM).

