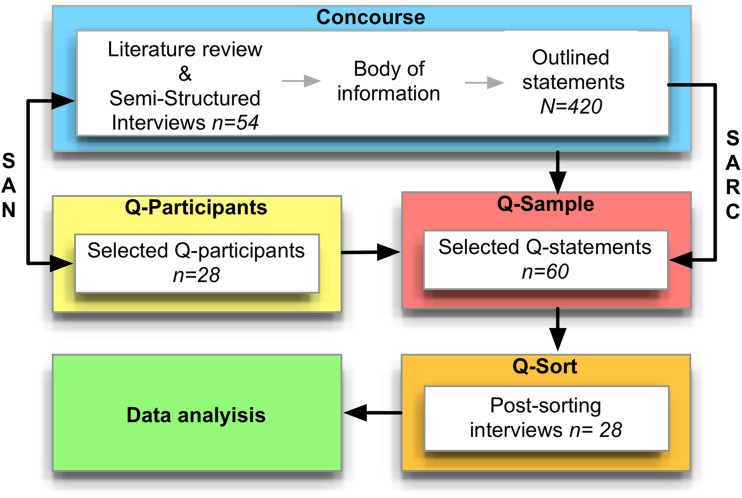
Fig. 2.
Diagram flow for gathering data in Q methodology. From the top left to right: a stakeholder analysis (SAN) was used to identify and capture the spectrum of opinions occurring in Galapagos (Table S2) and to further identify relevant Q-participants. A structured approach to reduce the concourse (SARC) from 420 to 60 statements was used to generate the Q-sample. Q-participants ranked the Q-statements according to her/his preferences (agreement or disagreement) over a forced Gaussian distribution from −6 to +6 (Fig. 3). Post-sorting interviews were conducted to record participants’ reactions to particular statement(s) of their interest, upon Q-sort completion

