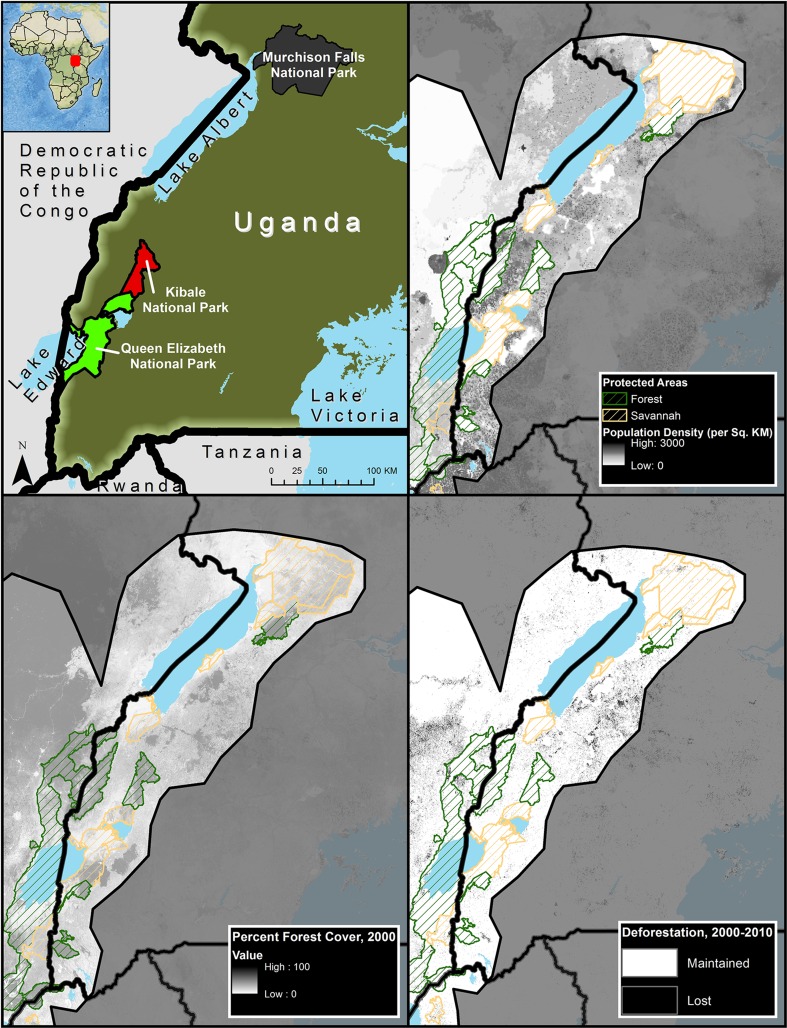
Fig. 1.
Upper left National parks where surveys were conducted; upper right park boundaries overlaid on population density showing the high human population surrounding Ugandan parks; lower left forest cover in 2000 illustrating the island character of Ugandan parks; lower right deforestation between 2000 and 2010; forest parks outlined in green and savannah parks outlined in orange. Gray area is the area outside of the Albertine Rift, and the shading was used to draw readers attention to the Albertine rift area

