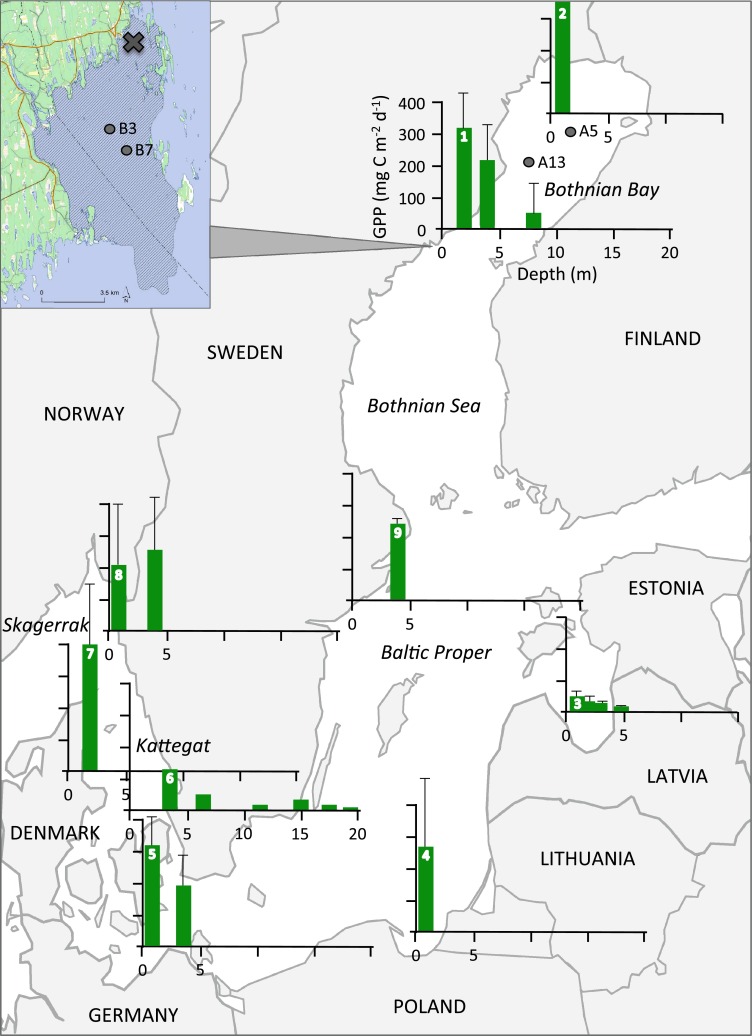
Fig. 1.

A compilation of studies measuring primary production by benthic microalgae in the Baltic Sea, here divided into five main areas: Bothnian Bay, Bothnian Sea, Baltic Proper, Kattegat and Skagerrak. The insert shows the extension of the Öre estuary (shaded area), and the sampling site for this study is marked with an X. The monitoring stations used for pelagic primary production are shown in the map (A5 and A13) and in the insert (B3 and B7). For the graphs, benthic gross primary production (GPP, mg C m−2 day−1) is presented on the y-axis and depth (m) on the x-axis. All graphs are plotted on the same scale as graph 1 (this study) and arranged so that the bar representing the most shallow depth is placed on or close to the sampling site. Error bars represent the standard deviation for a seasonal mean (here March–October), and were calculated when possible. The graphs are numbered (on the bar representing the most shallow depth) and the sources of the data are described accordingly in Table 1
