
Fig. 3.
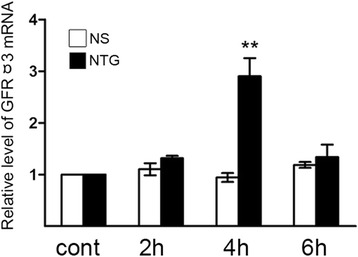
Alteration of GFRα3 mRNA expression in the TG after NTG treatment. The expression of GFRα3 mRNA was significantly increased at 4 h following NTG treatment compared with that in the normal control group (** P < 0.01). No significant change in NS control group was observed compared to normal control group. The data shown here were mean ± SEM of three separate experiments