
Fig. 5.
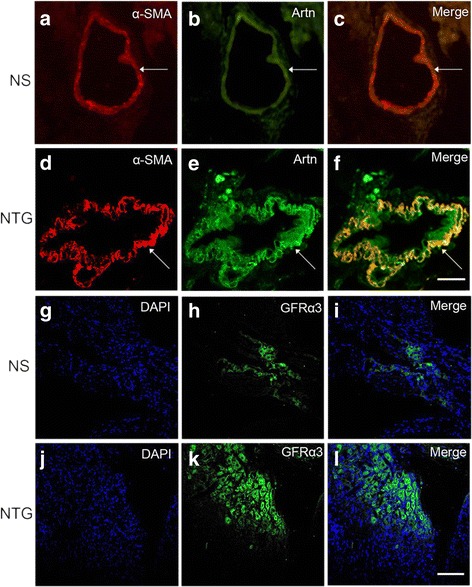
Immunostaining of artemin in the dura mater and GFRα3 in the TG after NTG treatment. a-c Immunohistochemical staining for α-SMA (red) and artemin (Artn, green) in the dura mater of NS control group. d-f Artemin was strongly expressed in the dura mater after NTG treatment. g-i Immunohistochemical staining for DAPI (blue) and GFRα3 (green) in the TG of NS control group. j-l The number of GFRα3-positive neurons was elevated after NTG treatment. c, f, i, l The same field of merged vision. Scale bar = 100 μm