
Figure 3.
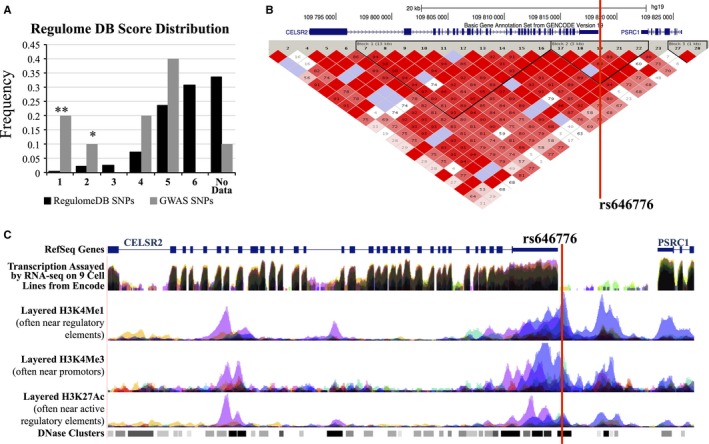
Analysis of regulatory element marks in loci associated with serum IGF‐1 and IGFBP‐3 concentrations. (A) IGF‐1‐ and IGFBP‐3‐associated SNPs are enriched for putative regulatory elements compared with all SNPs in RegulomeDB. **P < 0.005, *P < 0.05 (Monte Carlo). Overall distribution of genomewide association study (GWAS) SNPs vs. RegulomeDB SNPs P < 2.2E‐16, multinomial method. (B) Genomic context surrounding rs646776 showing R 2 values. (C) Representative regulatory motif tracks from USCS Genome Browser and encode showing histone mark peaks and DNase hypersensitivity at the location of rs646776.