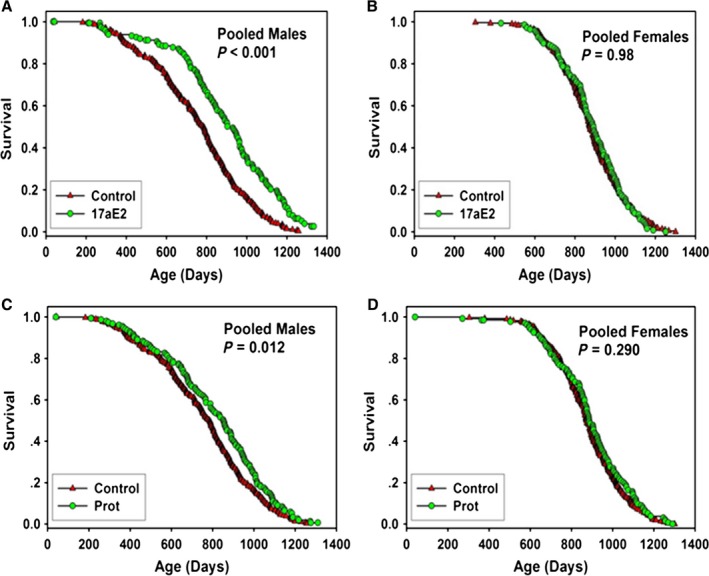
Figure 1.

Survival curves for mice treated with 17‐α‐estradiol (17aE2) or Protandim (Prot) pooled across sites. (A) males treated with 14 ppm 17aE2. (B) females treated with 14 ppm 17aE2. (C) males treated with Prot at 600 ppm (10–17 months of age) followed by 1200 ppm (17 months of age on). (D) females treated with Prot at 600 ppm (10–17 months of age) followed by 1200 ppm (17 months of age on). Each symbol represents one mouse. P‐values reflect log‐rank test, stratified by test site. See Table 1 for statistical results.
