
Figure 2.
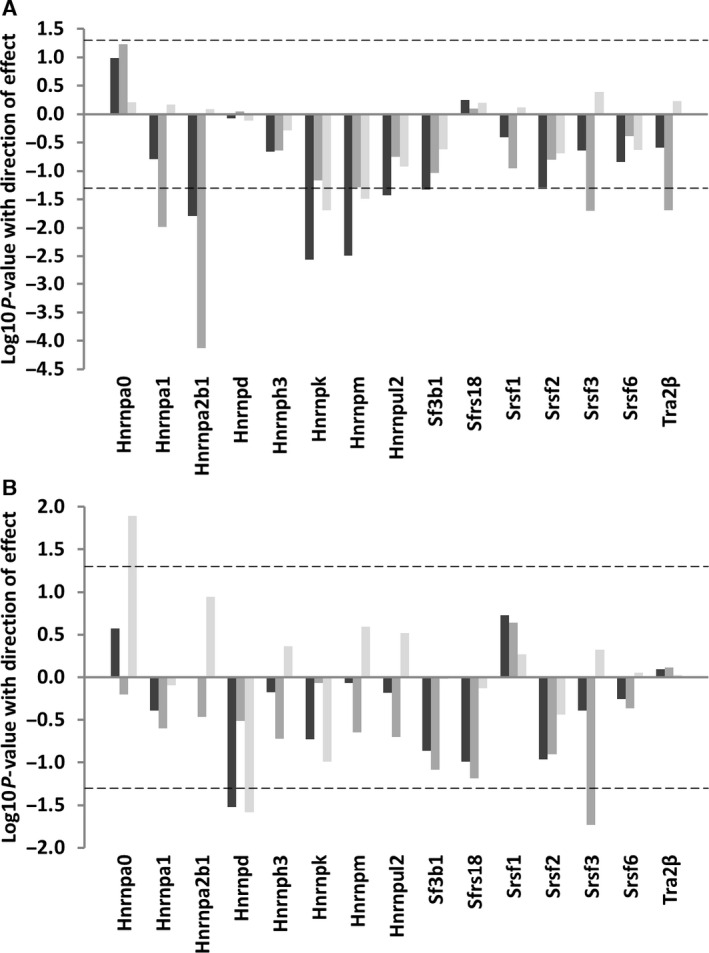
Splicing factor expression according to mouse lifespan. This plot illustrates association between median lifespan and slicing factor expression in total RNA from spleen (A) or muscle (B) tissues in mice of 6 strains of different longevities, as assessed by linear regression against median strain lifespan. The identity of specific splicing factors is given on the x‐axis. The log10 P‐values for associations between lifespan and splicing factor expression from mice of strains with different lifespans and of different ages are given on the y‐axis. Direction of effect is also indicated; data appearing above the zero line on the y‐axis represent positive associations, whilst data appearing below the zero line represent negative associations. Analysis including all animals in the sample is given by dark grey bars, in young animals only by medium grey bars and in old animals only by light grey bars. The dotted line refers to a P‐value cut‐off for statistical significance of P = 0.05.