Figure 3.

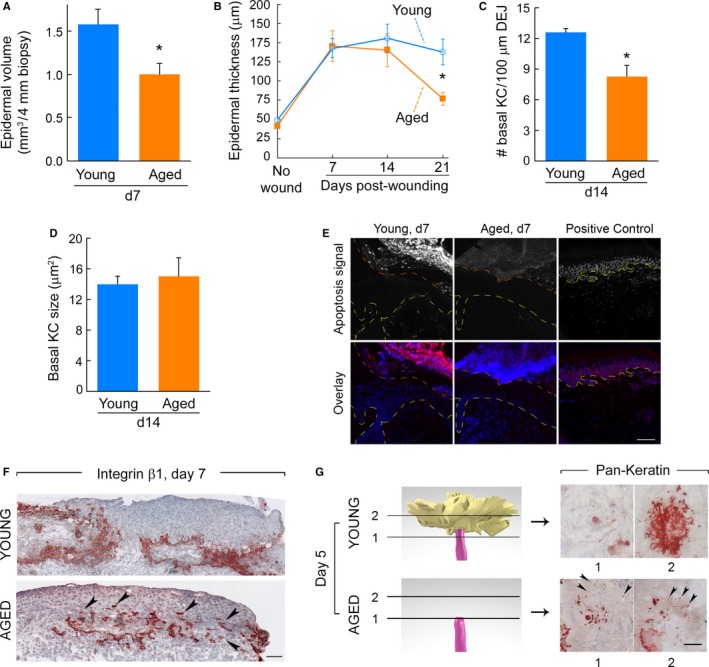
Aging is associated with reduced cohesiveness of ESG‐derived progeny. (A) Volume of repaired epidermis per 4‐mm biopsies in young and aged skins taken 7 days post‐wounding. (B) Epidermal thickness measured on 2D images in young and aged skin samples overtime. N = 7–9/age group for each time point. For all, *: P < 0.05 between young and aged. (C) Basal keratinocyte (KC) density. Number of KCs forming the basal layer was normalized to linear length of dermal–epidermal junction (DEJ). N = 6/age group. (D) Surface area of individual basal KCs. N = 6/age group. (E) Repaired epidermis is devoid of apoptotic cells in young and aged skin. DNA fragmentation was labeled with rhodamine (red fluorescence) using an apoptosis detection kit on wounded skin taken 7 days post‐wounding from young (left) and aged (middle) individuals. Positive control (right) is nonwounded skin digested with DNaseI. Top row: rhodamine fluorescence in grayscale (‘apoptosis signal’). Bottom row: overlay of apoptosis signal (red) and DAPI nuclear counterstaining (blue). Yellow lines delineate dermal–epidermal junctions; orange lines delineate epidermis–scab junction. Epidermis representative of 5 per age group. Scale bar = 100 μm. (F) Beta1‐integrin staining of transversally cut skin sections obtained 7 days post‐wounding. Positive staining is red, and hematoxylin counterstaining is blue. ESG‐derived outgrowths expand between the scab and the dermis in young (top) and aged (bottom) individuals (those with ESG‐derived outgrowths). Arrows in bottom panel point to isolated groups of cells present mostly in the scab and without apparent cohesion with the rest of the ESG‐derived outgrowth. Scale bar = 100 μm. (G) Left: 3D reconstruction of skin sample obtained 5 days post‐wounding showing a close‐up of the topmost portion of a representative ESG duct in young (top, with outgrowth) or aged (bottom, no outgrowth). Arbitrary colors are magenta for ESGs and yellow for outgrowth. Right: pan‐keratin‐immunostained horizontal sections used to make the 3D reconstructions; shown are two sections corresponding to the cutting planes (1 and 2) represented on 3D reconstruction in left panels. In young samples (top), pan‐keratin‐positive cells (red) form cohesive outgrowths above eccrine ducts. In aged samples, numerous pan‐keratin‐positive isolated cells surround the duct of ESGs (arrows), but do not form cohesive outgrowths. Scale bar = 50 μm.
