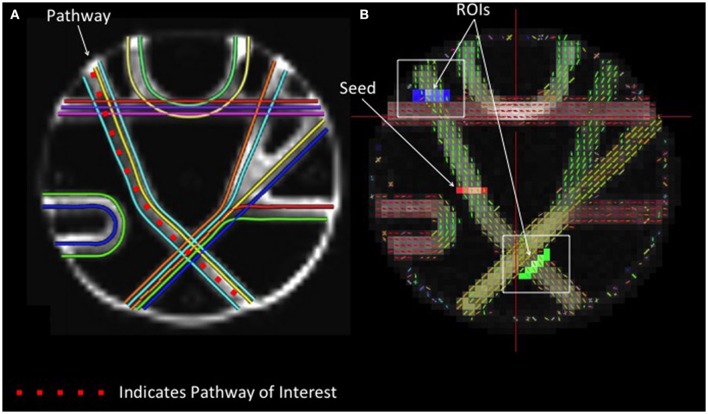
Figure 1.
Phantom Fiber Length Analysis. (A) (Left) Illustrates ground truth fiber orientations within each segment of the Fibercup phantom. Each color represents a distinct fiber pathway. (B) To test the accuracy of each reconstruction scheme for estimating fiber length, we placed a seed in one pathway and defined regions of interest immediately following the fiber crossings (blue and green) to isolate only those streamlines that traverse the crossings. For resulting streamline length estimates refer to Figure 4. ROIs: regions of interest.

