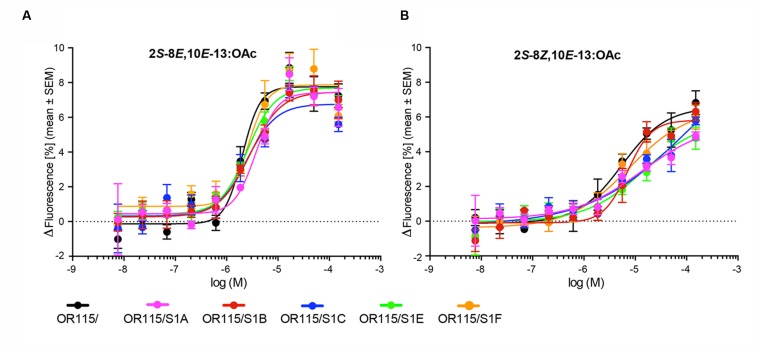
FIGURE 3.
Dose-response curves of six HEK293/TMO/MdesOR115 cell lines, with or without SNMP1 (S1). Means (±SEM) are derived from three to four biological replicates (n = 3–4), each including three technical replicates (i.e., total n = 9–12). (A) Responses to 2S-8E,10E-13:OAc, and (B) 2S-8Z,10E-13:OAc.

