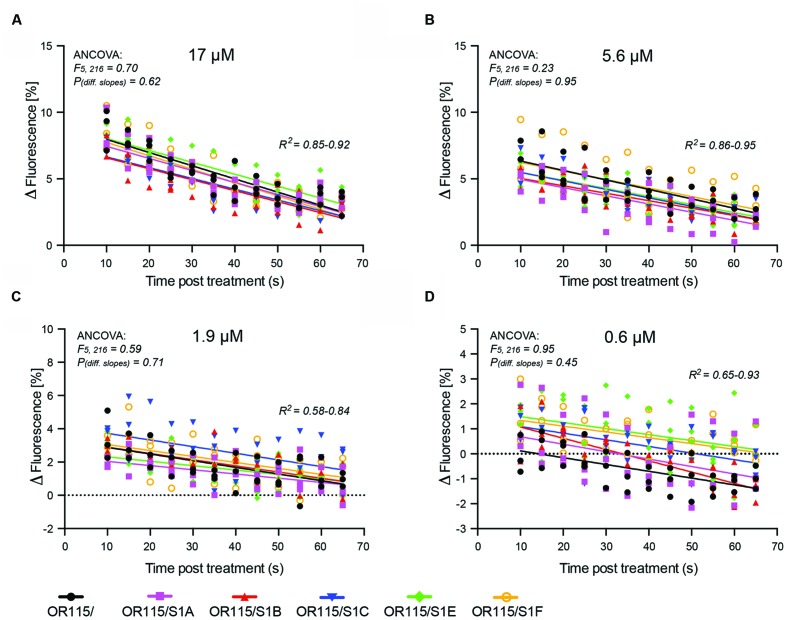
FIGURE 4.
Temporal response change post treatment of 2S-8E,10E-13:OAc in six HEK293/TMO/MdesOR115 cell lines, with or without SNMP1 (S1). (A–D) show responses to decreasing ligand concentrations. Analyses of covariance show that the slopes do not differ between different cell lines. Each data point (biological replicate) is the average of three technical replicates (n = 3–4 biological replicates, total n = 9–12).

