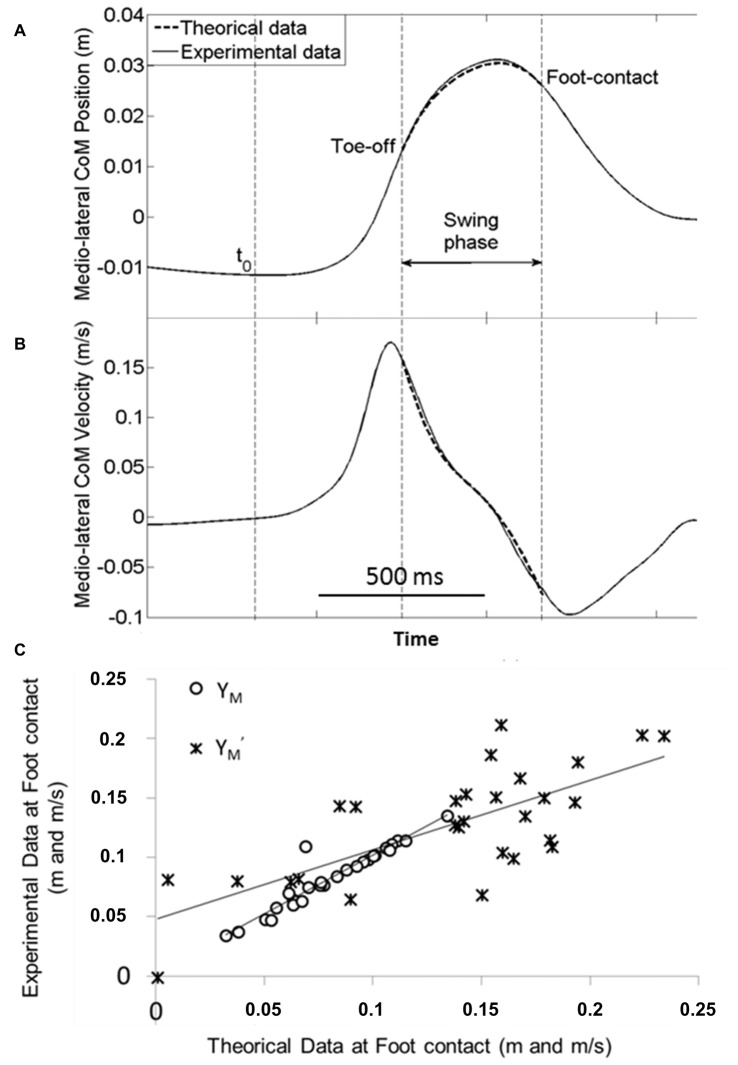
Figure 6.
Validation of the mechanical model. Typical experimental (full line) and theoretical (dash line) time-course traces of the ML center of mass shift (A) and velocity (B) are superimposed during the swing phase (from swing foot off to foot contact). Traces are obtained from one representative subject in the reaction-time condition with the medium height and short distance obstacle. (C) Example of linear regression between experimental vs. theoretical data obtained in the obstacle free (control) condition. Each point represents the average value of the ML center of mass position (YM) and velocity (Y′M) at foot contact in the control conditions (self-initiated and reaction-time conditions pooled together) for each of the 14 subjects. Note the excellent fit between the experimental and theoretical data.

