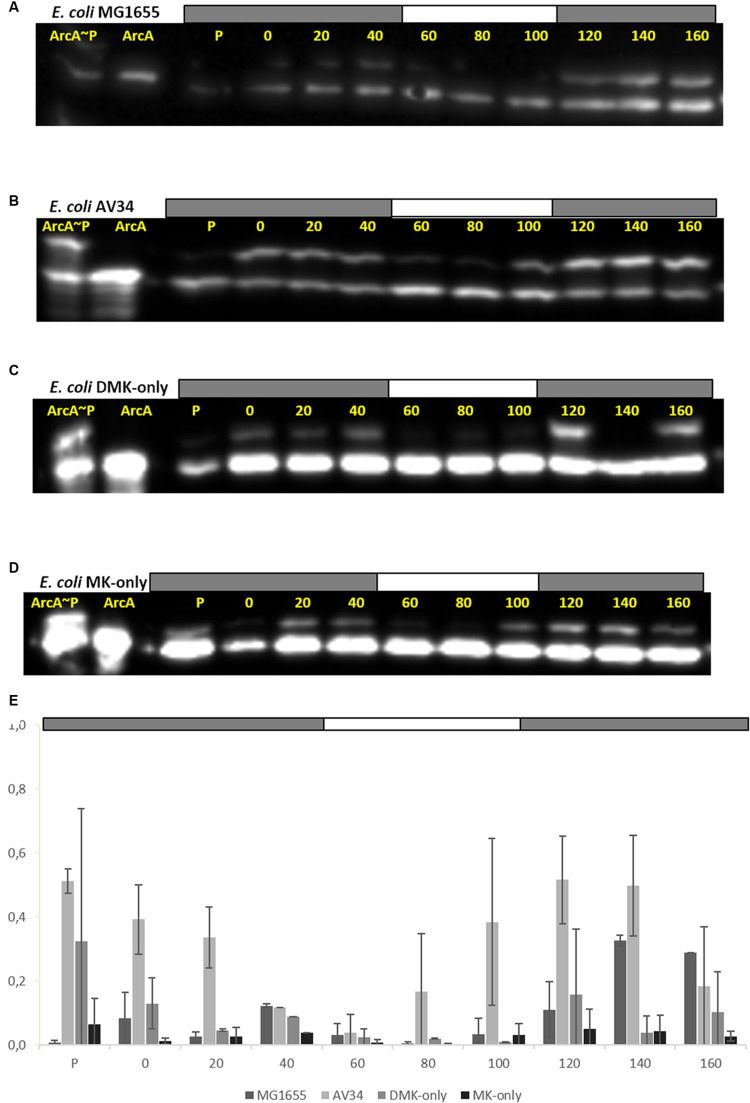
FIGURE 4.
All quinones of E. coli can both reduce (activate) and oxidize (inactivate) ArcAB/A. ArcA∼P Phos-Tag Western Blot of E. coli strain used in this study. The lower band represents ArcA while the upper band represents ArcA∼P, which is slowed down by the Phos-Tag gel during electorphoresis. The first two lanes are reserved for the ArcA standard, and in-vitro phosphorylated ArcA, respectively. P indicates the pre-culture and the other lanes the sampling time (min). The bar on top of (A–D) indicates N2 (gray) or air (white) sparging. (A) E. coli MG1655, (B) E. coli AV34 (UQ-only), (C) E. coli DMK-only, (D) E. coli MK-only, (E) Graph of the phosphorylation level of ArcA in the different strains used in this study. The bar graphs shows the results of densitometric quantitation of the ArcA∼P/ArcA ratio. Data represent the average of three biologically independent replicates, error bars indicate the standard deviation.

