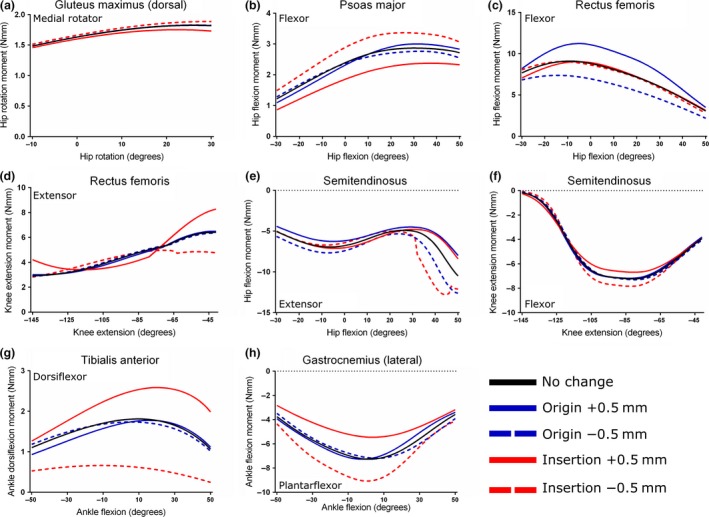
Figure 11.

Sensitivity analysis of the Gluteus maximus (dorsal) (a), Psoas major (b), Rectus femoris (c, d), Semitendinosus (e, f), Tibialis anterior (g) and lateral Gastrocnemius (h) muscles. Here, the coordinates of origin and insertion were changed ± 0.5 mm in turn to test the effect on maximal muscle moment.
