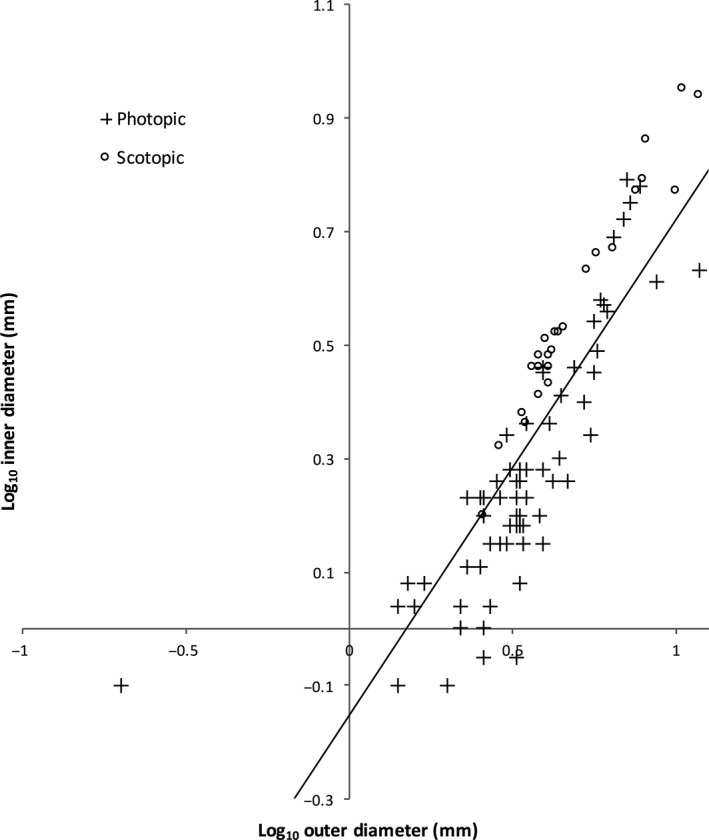
Figure 4.

Scatterplot showing the relationship between the outer diameter and the inner diameter of the sclerotic line. Log10 values were taken of all the measurements and plotted. The line of best fit for photopic (n = 75) and scotopic (n = 25) specimens is shown. A correlation test indicated a positive relationship between the two measurements (r 2 = 0.712).
