
Figure 1.
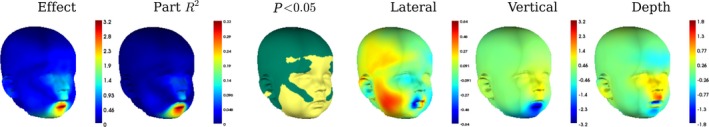
The regression of Procrustes residuals onto ratings of mouth openness. Shows the effect magnitude (effect) and the effect decomposed into lateral, vertical and depth directions. In ‘lateral’, red indicates (viewers) right‐directed displacement, blue indicates left‐directed displacement. In ‘vertical’, red indicates superior displacement, blue indicates inferior displacement. In ‘depth’, blue indicates posterior displacement and red indicates anterior displacement. The units of the colour‐bars for these images are mm. Partial R 2 indicates the amount of variability in the location of each quasi‐landmark that is explained by mouth openness. P < 0.05 indicates the areas where partial R 2 was significant.