Figure 7.

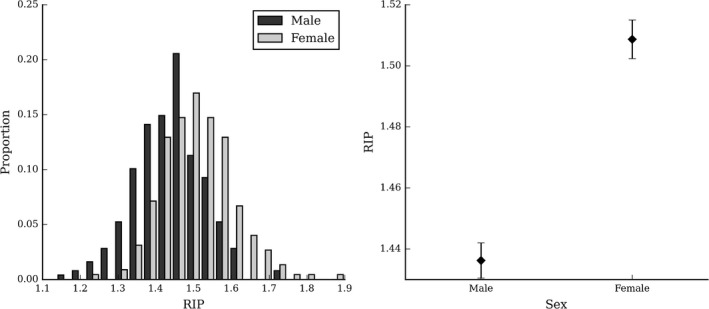
Imputed masculinity–femininity. This shows the distribution (left) and mean (right) of the RIP values for males and females. Error bars indicate the standard error of the mean.

Imputed masculinity–femininity. This shows the distribution (left) and mean (right) of the RIP values for males and females. Error bars indicate the standard error of the mean.