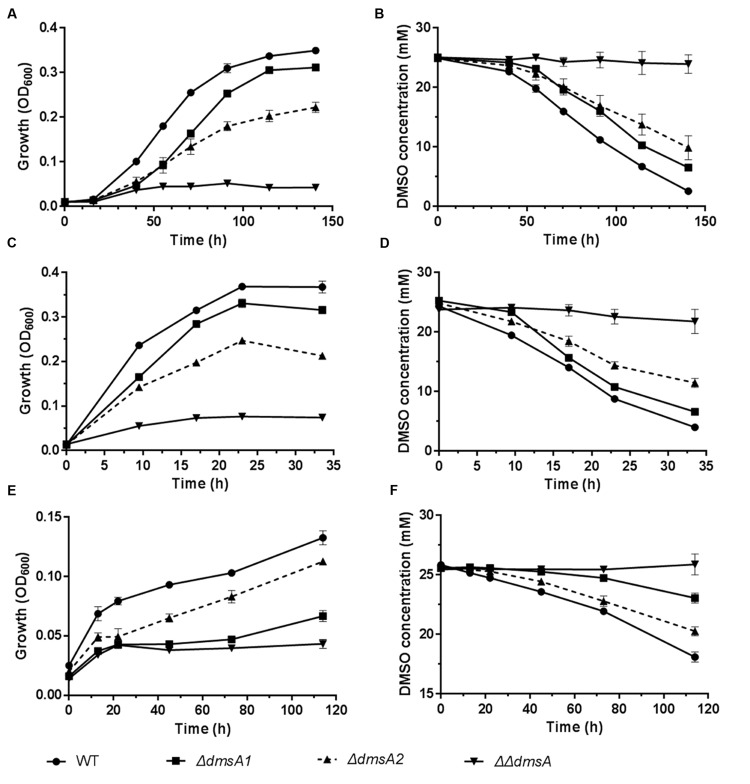
FIGURE 5.
Growth and corresponding DMSO consumption curves of WP3 mutants at different temperatures and pressures with DMSO as the sole electron acceptor. (A,B) 4°C and 0.1 MPa; (C,D) 20°C and 20 MPa; (E,F) 4°C and 20 MPa. The data shown represent the results of two independent experiments and the error bars represent standard deviations of averages of triplicate cultures.

