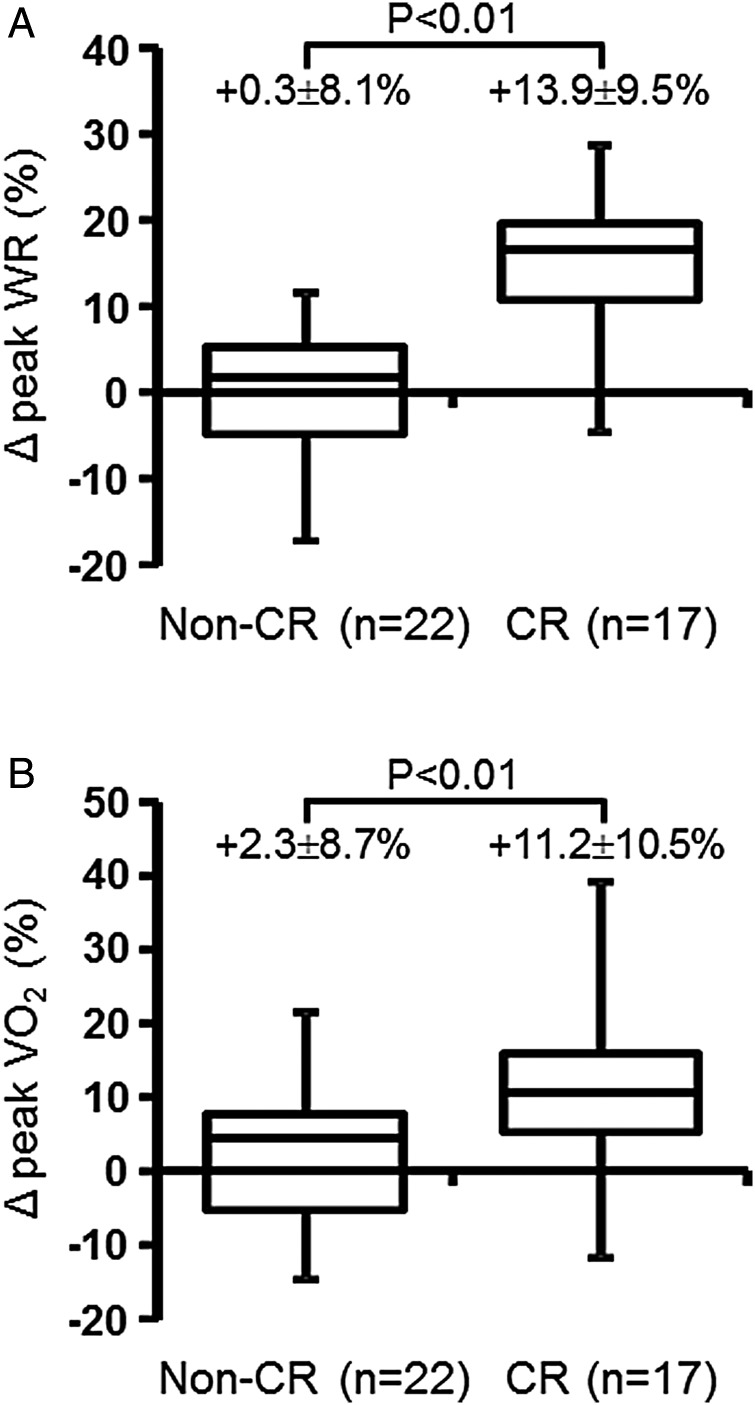
Figure 2.
Comparison of changes in peak work load (WR) and peak oxygen uptake (VO2) from baseline. At 12 weeks, the percentages of change from baseline in peak WR (Δ peak WR, %) (A) and peak VO2 (Δ peak VO2, %) (B) were significantly greater in the cardiac rehabilitation (CR) group (n=17) than in the non-CR group (n=22). p Values are given for the differences in Δ peak WR and Δ peak VO2 from baseline between the non-CR and CR groups using ANCOVA. Results are expressed as mean±SD.

