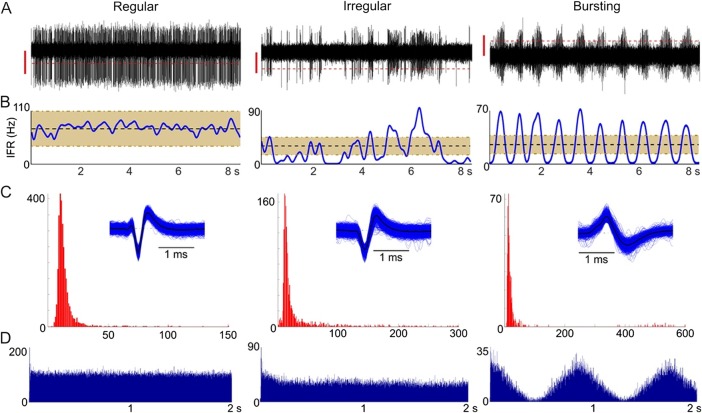
Figure 1.
Analysis of neuronal properties. Examples of regular, irregular and bursting cells: (A) raw activity (500–5000 Hz) showing the threshold for spike detection (dashed line). The vertical red lines represent 20 μV. (B) Instantaneous firing rate (IFR) over the same time period. Shaded area illustrates the mean firing rate (μ)±0.5 μ. (C) Interspike interval (ISI) distribution (note the different scales in the x-axes reflecting the greater dispersion of ISIs for irregular and bursting cells). Inset shows the superimposed waveforms of the detected spikes. (D) Autocorrelation histogram showing the typical flat profile of a regular cell, rhythmic peaks in a rhythmic bursting cell and an intermediate profile for an irregular cell.

