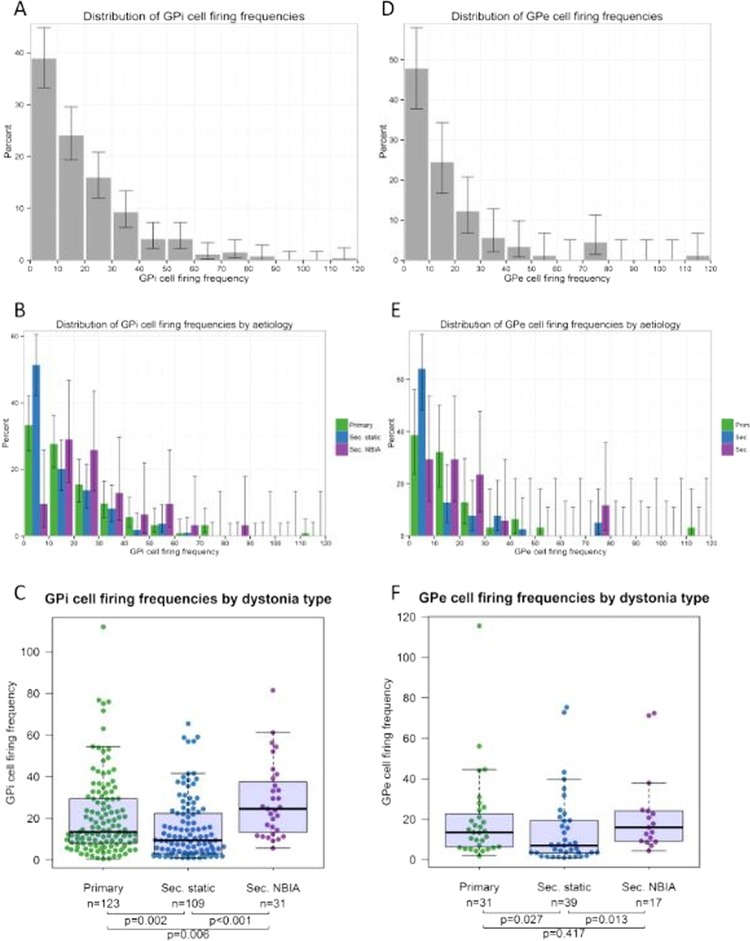
Figure 2.
Distribution of GPi (A–C) and GPe (D–F) cell firing frequencies. (A) Histogram shows percentage of GPi cells within each 10 Hz frequency bin. Lines show the 95% Agresti-Coull add-4 CIs. (B) Distribution of GPi cells by firing frequency for each of the three main subgroups. (C) Box-and-whisker plot of GPi cell firing frequencies for each dystonia group. Circles show firing frequency of individual cells. Horizontal lines within boxes show the group median, boxes show the IQR, and whiskers show the full range. (D–F) Equivalent figures for GPe cells. The Kruskal-Wallis test showed a significant difference in the median firing frequency across the three groups for both GPi cells (p=0.00003) and GPe cells (p=0.03). The p values show the results of Mann-Whitney tests between groups. GPe, globus pallidus externa; GPi, globus pallidus interna.

