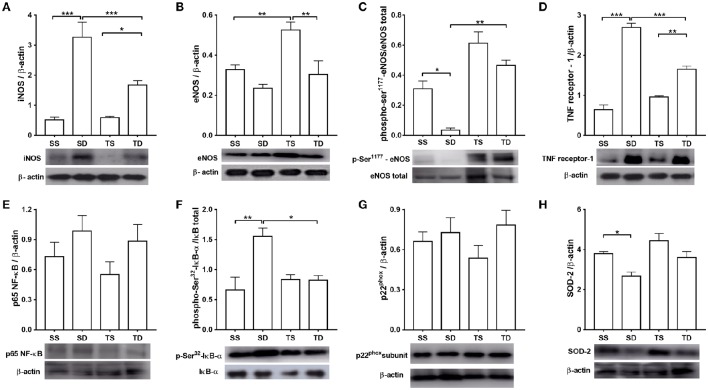
Figure 7.
Protein expression analyses in the mouse aorta. (A) iNOS, n = 6; (B) total eNOS, n = 6; (C) phosphorylation at eNOS-Ser1177, n = 5; (D) type 1 TNF receptor, n = 5; (E) p65 NF-κB subunit, n = 5; (F) phosphorylation at Ser32 IκB-α, n = 5; (G) phosphorylation at p22phox, n = 6; and (H) SOD-2, n = 5. The histograms represent mean ± SEM. Images are representative blots from the above experiments. *p < 0.05, **p < 0.01, and ***p < 0.001, one-way ANOVA with Tukey post-hoc test. SS, sedentary + standard chow group; SD, sedentary + high-sugar diet group; TS, trained + standard chow group; TD, trained + high-sugar diet group.

