


Fig. 3.
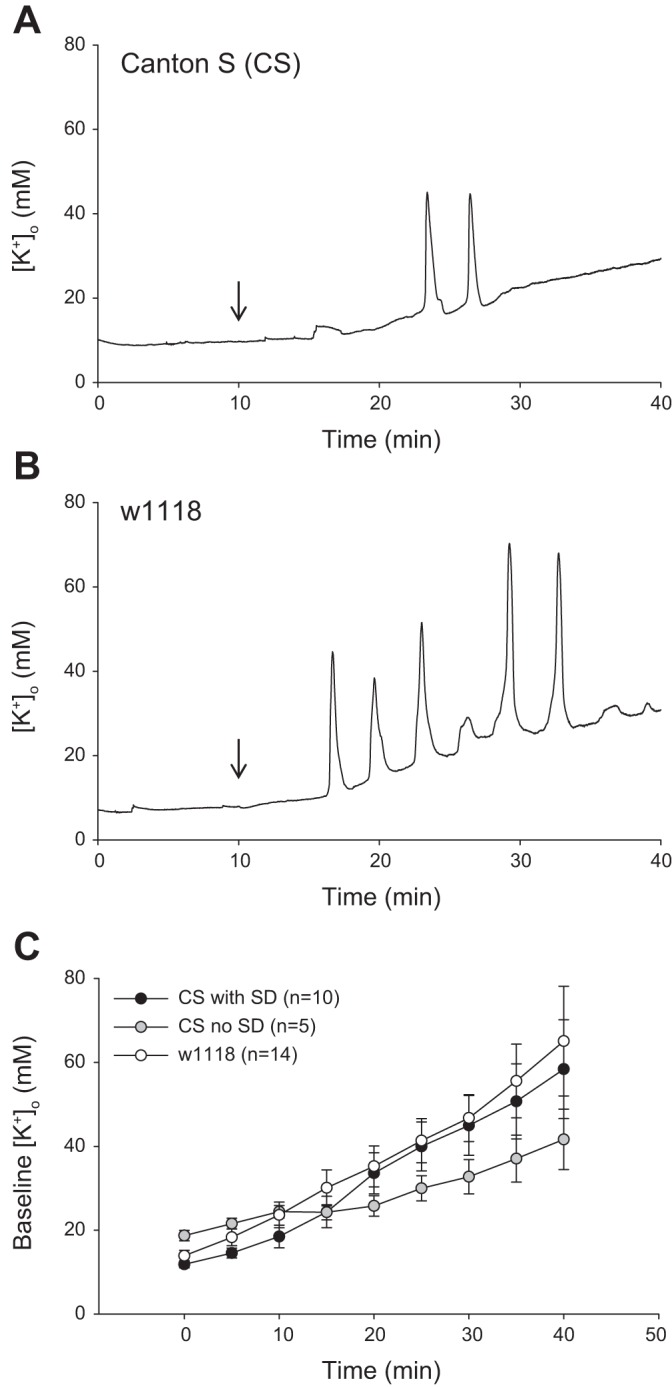
Ouabain-induced SD in wild-type CS flies and w1118 mutants. A and B: representative recordings of [K+]o dynamics during ouabain-induced SD in CS (A) and w1118 (B). Downward arrows denote the time of ouabain application. C: baseline [K+]o levels (millimolar) recorded throughout the 40-min treatment period with ouabain in CS (flies that exhibited SD: black circles; no SD: gray circles) and w1118 (white circles). Baseline [K+]o was measured before ouabain injections (Time = 0) and every 5 min thereafter. Data are plotted as means ± SE.