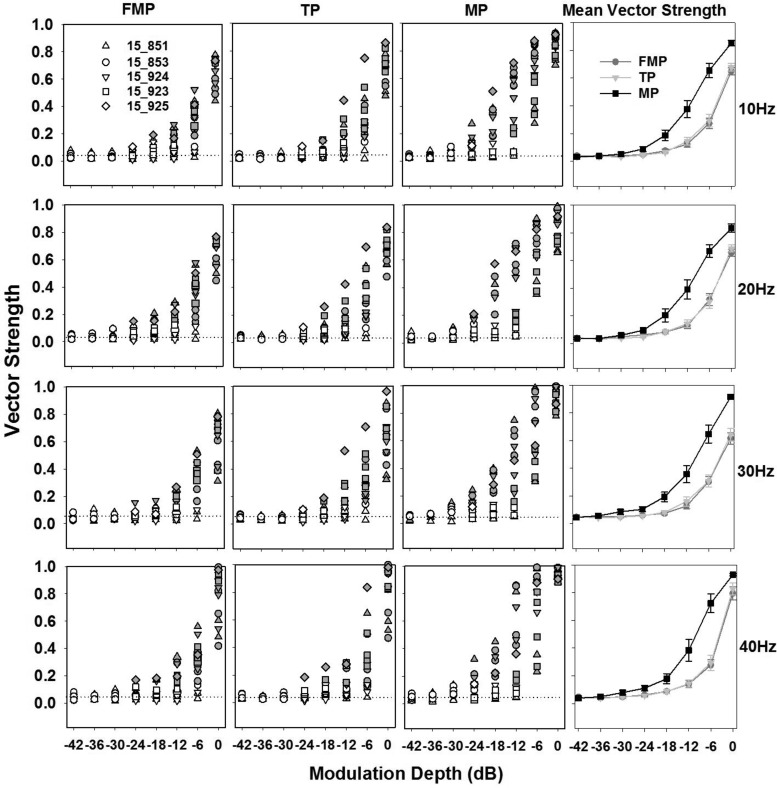
Fig. 8.
Distribution of vector strengths across the best recording sites from all the animals for FMP, TP, and MP stimulation configurations, as indicated. Each row represents vector strengths for modulation frequencies of 10, 20, 30, and 40 Hz. Each individual animal's data are represented with a different symbol. Every vector strength is shown, with closed symbols indicating statistically significant vector strengths (P < 0.01, Rayleigh test) and open symbols indicating those that failed to produce significant phase locking. Dotted lines indicate the average vector strength computed across the best recording sites when stimulated with unmodulated pulse trains in a particular stimulation configuration. The modulated pulse trains are presented at 2dB above the threshold of an unmodulated pulse train. Far right column shows mean vector strength (mean ± SE) vs. modulation depth across different stimulation configurations (n = 17 recording sites across 5 animals).

