Figure 2.
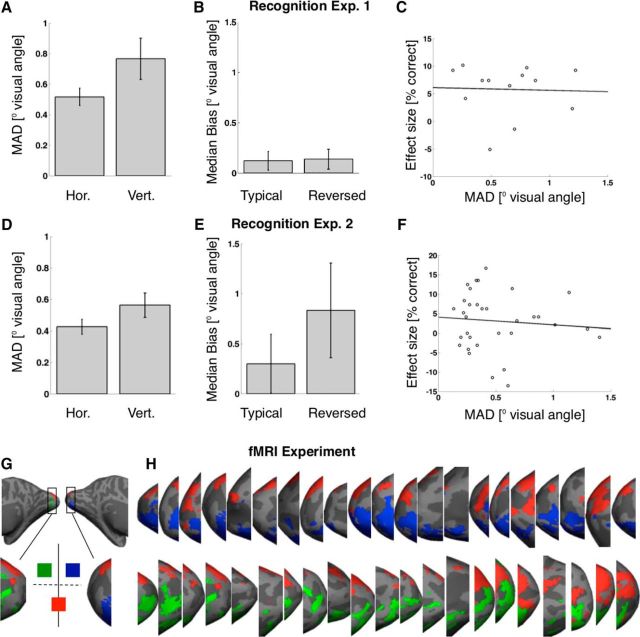
Fixation compliance. Top (A–C) and bottom (D–F) rows represent data from recognition Experiments 1 and 2, respectively. Right panels (G–J) represent the results of a gaze control analysis for the fMRI experiment. A, C, Median absolute deviation (MAD) from fixation during stimulus presentation (in degrees visual angle). Left and right bars represent deviation along the horizontal and vertical axes, respectively. Generally, fixation compliance was good, with average median absolute deviations from fixation of 0.52 (±0.06 SEM; Experiment 1) and 0.43 (±0.05 SEM; Experiment 2) degrees visual angle on the horizontal axis and 0.77 (±0.13 SEM; Experiment 1) and 0.56 (±0.08 SEM; Experiment 2) degrees visual angle on the vertical axes. B, E, Median bias of gaze direction toward stimuli (along the vertical axis and in degrees visual angle). Left and right bars represent bias during presentation of stimuli in typical and reversed locations, respectively. Deviation from fixation was not significantly biased toward stimuli in either typical (Experiment 1: average bias 0.12 (±0.09 SEM) degrees visual angle, t(12) = 1.30, p = 0.22; Experiment 2: 0.30 (±0.29 SEM) degrees visual angle, t(32) = 1.02, p = 0.32) or reversed trials (Experiment 1: 0.14 (±0.10 SEM) degrees visual angle, t(12) = 1.39, p = 0.19; although there was a nonsignificant trend in Experiment 2: 0.83 (±0.47 SEM) degrees visual angle, t(32) = 1.76, p = 0.09). There was no significant difference in bias between conditions either (Experiment 1: t(12) = −0.89, p = 0.39; Experiment 2: t(31) = −1.74, p = 0.09). C, F, Scatter plot of individual effect size versus individual deviation from fixation. Effect size is defined as the recognition advantage for stimuli presented at typical versus reversed locations (in percentage correct answers). Deviation from fixation is the median absolute deviation in degrees visual angle (averaged across the horizontal and vertical axes). Each circle represents data from one participant. A line indicates the least-squares fit to the data. Individual differences in the propensity for eye movements did not predict individual differences in the size of the hypothesized effect in Experiment 1 (r(11) = −0.04, p = 0.91) or 2 (r(31) = −0.09, p = 0.62). Error bars indicate the mean across participants ± SEM. G, Retinotopic control analysis testing fixation compliance during the fMRI experiment. We projected binary activation maps onto the inflated cortical surfaces, each map corresponding to one of the three stimulus locations in our design (compare Materials and Methods). Green, blue, and red activation maps represent the left, right upper, and the lower visual field position, respectively, as shown. We then investigated the activation profile in early visual cortex for each participant (i.e., medial, posterior occipital, surrounding the calcarine sulcus). H, Activation profiles in left (top row) and right (bottom row) EVC of each participant. As expected under fixation compliance, stimuli shown at the lower visual field position evoked bilateral dorsal activations, and stimuli shown at the upper visual filed positions activated contralateral ventral EVC.

