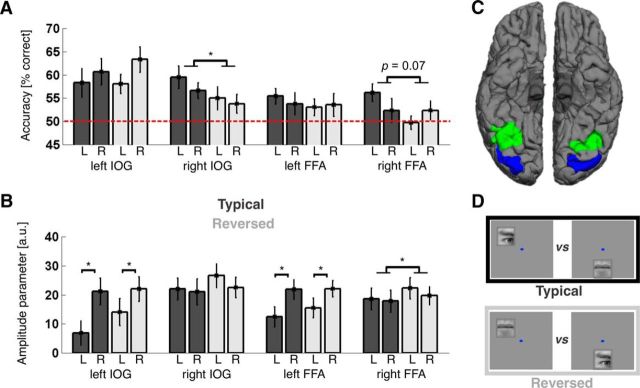
Figure 4.
Main neuroimaging results. A, Classification performance by condition and visual hemifield for each ROI. Bar plots and error bars indicate mean classification performance ± SEM for separating eye- and mouth-evoked patterns in the typical (dark gray) and reversed (light gray) conditions (for example stimuli, see D). Decoding performance for stimuli shown in the left and right visual hemifield is shown side by side for each ROI and condition (labeled L and R, respectively). The hemifield was dummy-coded for mouth stimuli, which were shown on the midline (see Materials and Methods). Dashed red line indicates chance level. ROIs are labeled on the x-axis. Classification performance was significantly better for the typical than reversed condition in right IOG (p = 0.04), and there was a similar trend in right FFA (p = 0.07). Furthermore, there was a significant hemifield × condition interaction in right FFA (p = 0.01), with a strong decoding advantage for typical compared with reversed stimulus locations in the contralateral left (p = 0.002), but not the ipsilateral right (p > 0.99) visual hemifield (compare Table 1). * p < 0.05. B, Response amplitude by condition and ROI. Values on the y-axis indicate response amplitudes elicited by face feature stimuli versus baseline trials in arbitrary units; bars and error bars indicate the mean and SEM across participants. Bars in dark and light gray represent the typical and reversed conditions, respectively, L and R indicate amplitudes for stimuli shown in the left and right visual hemifield, respectively. ROIs are labeled on the x-axis. Response amplitudes were significantly greater than 0 in all regions; left IOG and left FFA responded significantly stronger to stimuli in the contralateral right visual hemifield, and there was an overall trend for slightly stronger responses to stimuli shown at reversed compared with typical conditions (which was significant in right FFA, p = 0.048; compare Table 2). * p < 0.05. C, ROIs. Image represents the inferior view of both hemispheres for an example participant. Blue represents the IOG. Green represents the FFA. Surface reconstruction was done using FreeSurfer (compare Materials and Methods). D, Conditions. Top, Example pair of stimuli from the typical condition, showing eye and mouth features at typical locations relative to a fixation dot (shown in blue). Bottom, Position of the same features in the reversed condition. Classification aimed at separating patterns of BOLD signals evoked by one or the other member of such pairs.

