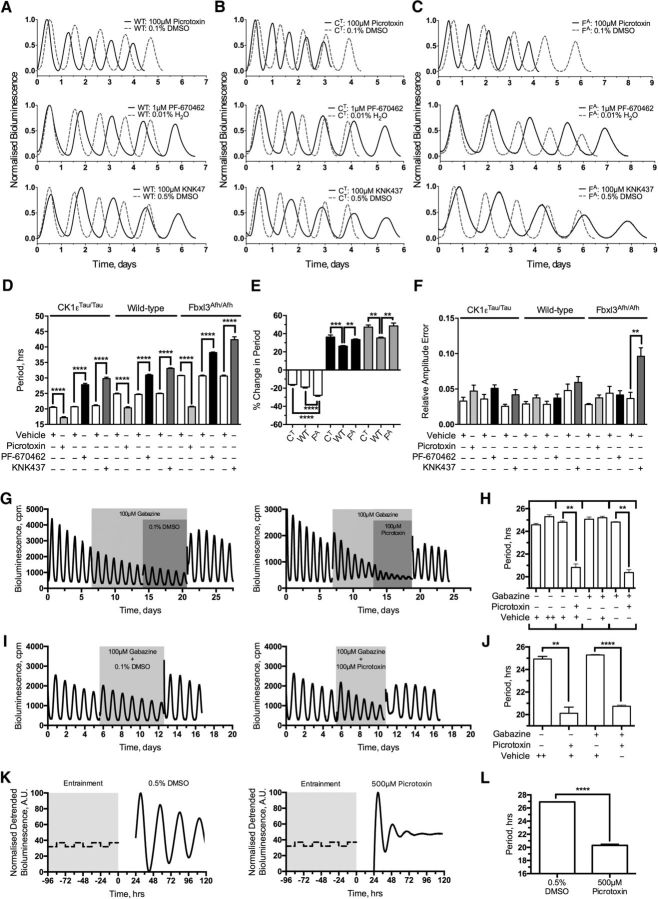
Figure 1.
Genetic and pharmacological manipulation of the SCN period greatly extends the operational range of explant SCN slices. A–C, Example PMT traces showing normalized bioluminescence for treatment intervals. Treatments are as follows: 100 μm picrotoxin/0.1% DMSO (top), 1 μm PF-670462/0.01% H2O (middle), and 100 μm KNK437/0.5% DMSO (bottom). Treatment (solid black) is overlaid with vehicle traces (dashed gray) grouped by genotype. A, Wild-type PER2::LUC (WT). B, CK1εTau/Tau × PER2::LUC (CT). C, Fbxl3Afh/Afh × PER2::LUC (FA). D, Summary period data expressed as mean ± SEM from each treatment condition grouped by genotype. Treatments accompanied by their specific vehicles (white) are 100 μm picrotoxin (light gray), 1 μm PF-670462 (black), and 100 μm KNK437 (dark gray), as indicated. E, Summary data expressing the proportional change in period expressed the percentage change from baseline period induced by period-altering compounds and expressed as mean ± SEM. Bars are grouped by pharmacological treatment: 100 μm picrotoxin (white), 1 μm PF-670462 (black), and 100 μm KNK437 (gray). Genotypes are identified as CK1εTau/Tau×PER2::LUC, wild-type PER2::LUC (WT) and Fbxl3Afh/Afh × PER2::LUC. F, Summary RAE expressed as mean ± SEM from each condition grouped by genotype. Treatments accompanied by their specific vehicles (white) are 100 μm picrotoxin (light gray), 1 μm PF-670462 (black), and 100 μm KNK437 (dark gray), as indicated. G, Example PMT traces for continuous wild-type SCN explant experiments cotreated in series with 100 μm gabazine and 100 μm picrotoxin (right) and 100 μm gabazine and 0.1% DMSO (left). Treatment intervals are indicated by gray shaded regions. H, Summary period data as mean ± SEM for series cotreatment experiment. Treatments are as indicated, and in-series treatments are grouped by brackets. I, Example PMT traces for continuous wild-type SCN explant experiments cotreated with 100 μm gabazine and 100 μm picrotoxin (right) and 100 μm gabazine and 0.1% DMSO (left). Treatment intervals are indicated by gray shaded regions. J, Summary period data as mean ± SEM for cotreated experiments. Treatments are as indicated. K, Fibroblast representative traces (detrended) for 500 μm picrotoxin treatment (right) and 0.5% DMSO treatment (left). L, Summary period data for fibroblast experiments as indicated. n values are detailed throughout the text. *p < 0.05, **p < 0.01, ***p < 0.001, ****p < 0.0001.

