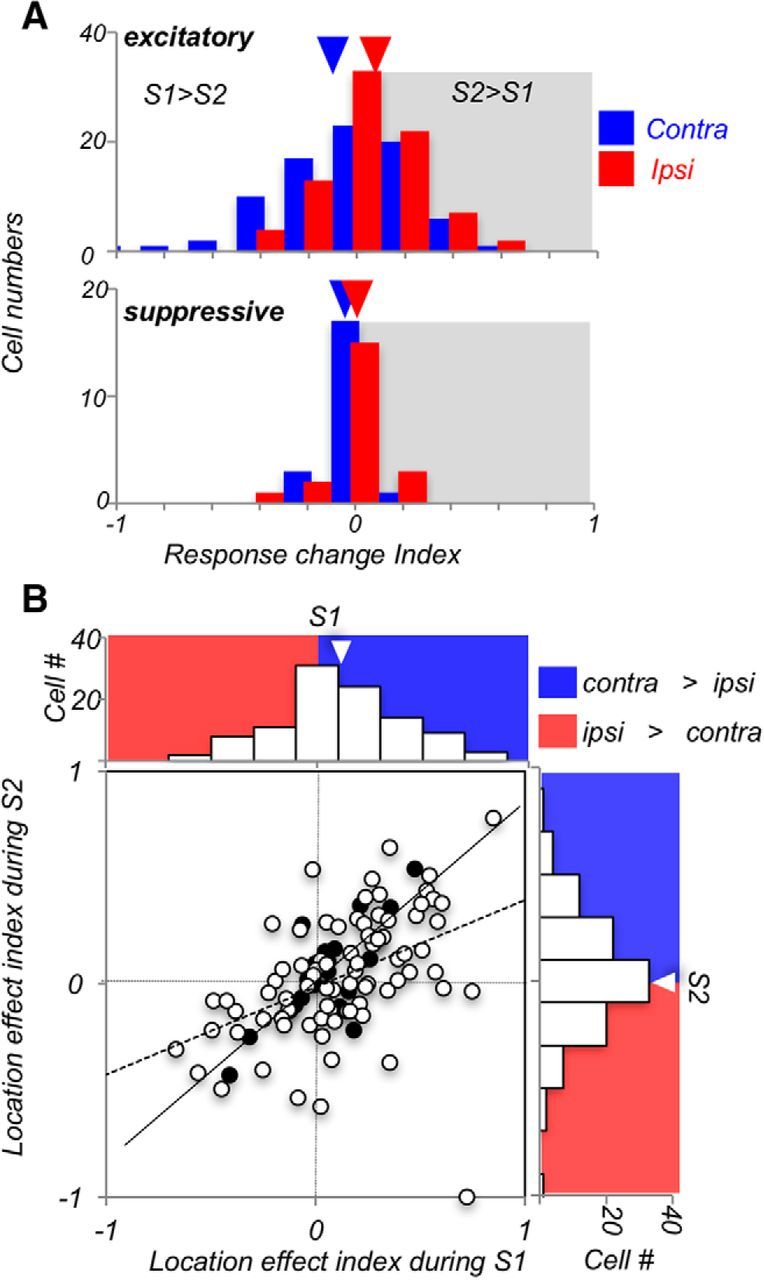
Figure 4.

Ipsilateral responses are enhanced during S2. A, Comparison of responses during S1 and S2. RCI = (S2 − S1)/(S2 + S1), comparing firing rates of responses to S1 and S2 recorded on the same trial, for contralateral and ipsilateral stimuli. Neurons with excitatory responses (top) show, on average, only little change for contralateral stimuli, and a predominantly positive RCI for ipsilateral stimuli, indicating stronger S2 responses in this condition (p = 0.018, Wilcoxon test). Responses of suppressive neurons (bottom) show only little differences between S1 and S2, and their RCI for contralateral and ipsilateral stimuli is not different (p = 0.38, Wilcoxon test). B, LEI = (contra − ipsi)/(contra + ipsi), comparing the strength of contralateral and ipsilateral responses during S1 and S2 for each neuron. The dominance of contralateral responses weakens during S2. Open circles represent excitatory cells (N = 81). Filled circles represent suppressive cells (N = 21). Regression lines (least-square fit to the data points) are shown for excitatory cells (solid lines) and suppressive cells (dashed lines).
