Figure 7.

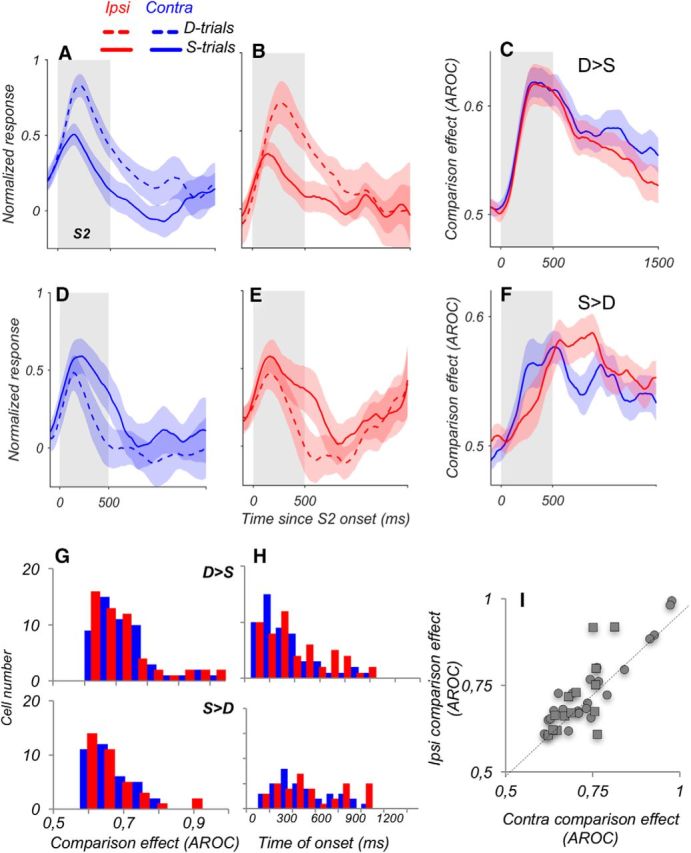
Similar CEs for contralateral and ipsilateral stimuli. A, B Average responses of D > S neurons with higher activity for trials in which the S2 moved in a direction different from S1 (D-trials; dashed lines), shown separately for contralateral (A) and ipsilateral (B) stimuli (contra, N = 53; ipsi, N = 54). Responses of individual neurons were normalized by subtracting the baseline activity and by dividing by the peak response during and after S2. C, Average CE computed for responses during S- and D-trials for D > S neurons, shown in A, B. The difference in firing rate between S-trials and D-trials was quantified with ROC analysis. D, E, Average responses of S > D neurons with higher activity for trials in which the S2 moved in the same direction as S1, shown separately for contralateral (D) and ipsilateral (E) stimuli (contra and ipsi, N = 36). F. Average CE for S > D neurons for stimuli in the two hemifields (N = 36), quantified with ROC analysis. G, Distribution of CEs for contralateral and ipsilateral stimuli, shown separately for neurons with D > S effects (top) and neurons with S > D effects (bottom). There was no difference in these effects for stimuli in the two hemifields (D > S, p = 0.18; S > D, p = 0.67). H, Time to the onset of CE for neurons with D > S (top) and S > D effects (bottom) reveals no significant differences between contra and ipsi conditions. I, Relationship of CEs for contralateral versus ipsilateral stimuli, for D > S neurons (●) and S > D neurons (■). For this analysis, we selected neurons with consistent CEs in both hemifields (i.e., D > S or S > D in both cases; N = 39 of 58 neurons with significant CEs in both conditions).
