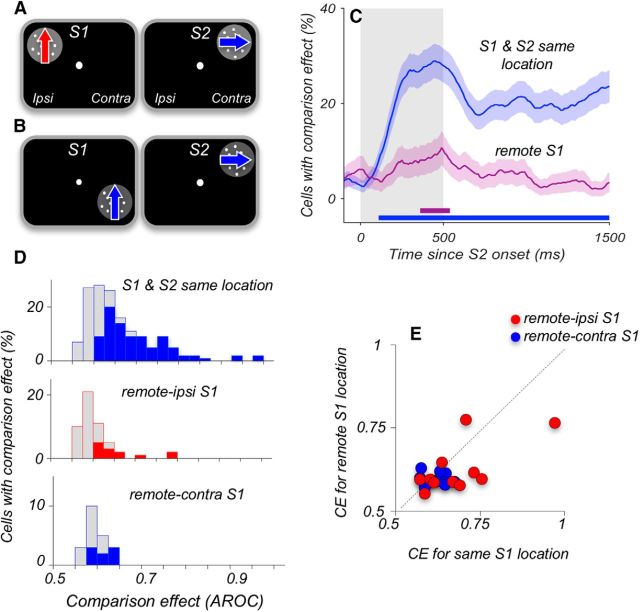
Figure 8.
Comparison signals weaken when S1 and S2 appear at different locations. A, B, Diagram of stimulus locations in the tasks with separated S1 and S2. S2 always appeared in the upper quadrant of the contralateral hemifield. In the remote-ipsi condition, S1 appeared in the corresponding location of the ipsilateral hemifield (A); and in the remote-contra condition, S1 appeared in the same hemifield as S2 but was displaced by 5° into the lower quadrant (B). In the standard version of our experiment (Fig. 1A), both S1 and S2 appeared at the same location. C, Percentage of neurons with significant CE at each time point, for S1 and S2 at the same location (N = 152 neurons) and for separated S1 and S2 stimuli (N = 73 neurons). The data recorded during the two conditions shown in A, B were combined. Gray shaded area represents the stimulus interval. Error bars indicate the SEMs obtained using bootstrap. Horizontal lines along the x-axis indicate periods where the incidence of CE is above chance level (p < 0.05; permutation test). D, Distribution of maximum CE recorded with S1 and S2 at the same contralateral location (top), for remote-ipsi (middle), and remote-contra (bottom). Filled colored columns represent neurons with significant CE (permutation test, see Materials and Methods). Gray columns represent neurons with nonsignificant CE. The data illustrate that only very few neurons carried significant CEs when S1 and S2 were spatially separated. E, CEs for neurons that were tested with overlapping and spatially separated S1 and S2 and showed significant CEs. The data illustrate on a cell-by-cell basis that the residual CEs were greatly weakened when the comparison stimuli were spatially separated (N = 23).

