
Figure 5.
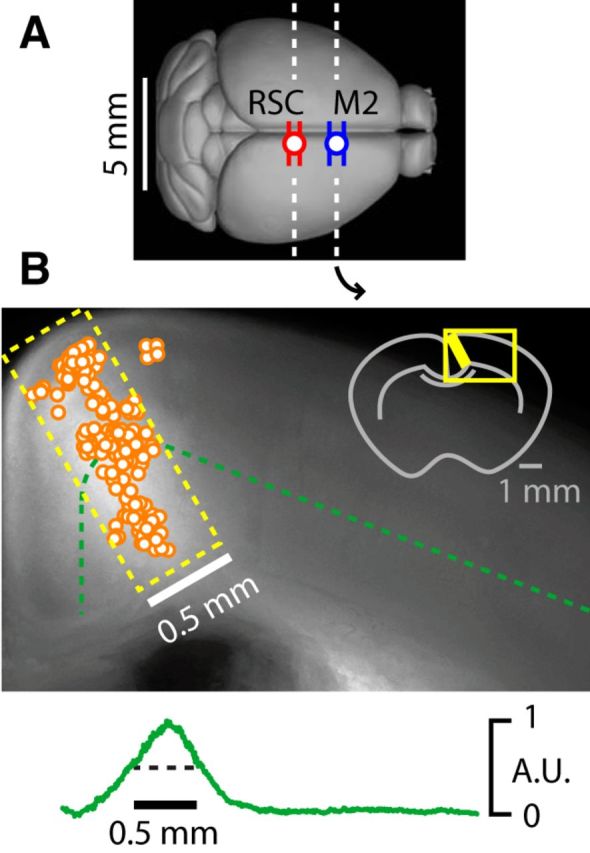
Anatomical locations of the RSC injections and M2 recordings. A, Locations along the rostrocaudal axis of the RSC injections (red circle; mean ± SEM) and M2 slices (blue circle; mean ± SEM) used in the experiments. B, Locations in the M2 slices of the recorded neurons (circles) are plotted on a median epifluorescence image of RSC axonal labeling in the M2. Bottom, Fluorescence intensity (plotted in arbitrary units, a.u.) along layer 5B (green dashed line in image).